

LTCUSD Medium-term Trend: Bullish
Resistance Levels: $80, $82, $84
Support Levels: $77, $75, $73
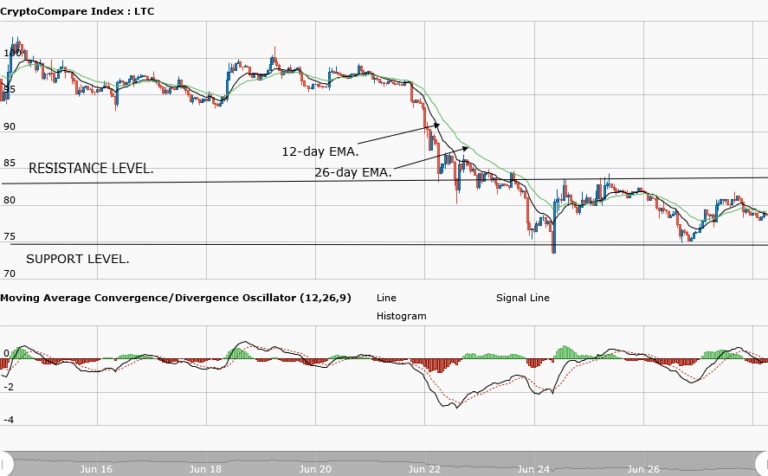
Yesterday, June 27, Litecoin was fluctuating above the $80 price level. Today, it is trading below it. On June 24, the cryptoasset fell to a low of $75 and fluctuated above and below the $80 price level. For some time now, Litecoin hasn’t been able to break the support level of $75 and the resistance level of $83.
Therefore, if the price keeps testing the resistance, traders can take short positions on it and place stop losses above its level. You can exit your short trades near the support zone. Similarly, if the price tests the support level, you can enter long positions and stop losses below that level. Exit near the resistance.
Meanwhile, the MACD and signal lines are above the zero line which indicates a buy signal. In addition, the price bars of Litecoin are above the 12-day EMA and the 26-day EMA which indicates that a bullish trend ongoing.
LTCUSD Short-term Trend: Ranging

On the daily chart, the cryptoasset is in a range bound movement. Litecoin made a bullish movement to a high of $81 and at the same time fell to a previous low of $78. Meanwhile, the relative strength index period 14 is at 68 which indicates that price is in a bullish trend zone.
The views and opinions expressed here do not reflect that of CryptoGlobe.com and do not constitute financial advice. Always do your own research.


