

LTCUSD Medium-term Trend: Bearish
Resistance Levels: $80, $82, $84
Support Levels: $76, $74, $72
Yesterday, June 26, The price of Litecoin was in a range bound movement trading above the $80 price level. The cryptoasset had earlier fallen to the support level at $75, and risen to the resistance level at $83 where it wasn’t able to push further. Litecoin hs now been fluctuating between the resistance level at $83 and the support level at $75.
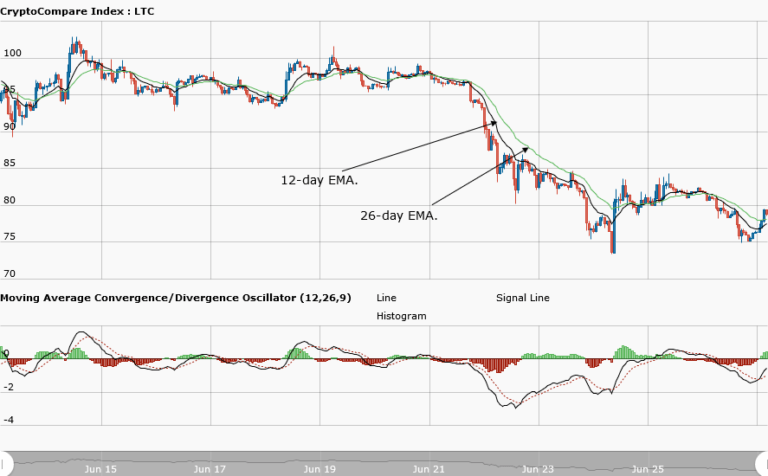
If the cryptoasset encounters a bearish breakout and the support level is broken, the price of Litecoin will find support at $46.91. Meanwhile, its MACD and signal lines are below the zero line which indicates a sell signal. In addition, the 12-day EMA and the 26-day EMA are above the price bars of Litecoin which indicates that a bearish trend ongoing.
LTCUSD Short-term Trend: Bullish

On the daily chart, the cryptoasset fell from the high of $81 to a low of $75. Later, it made a bullish movement to a high of $79. The 20-day SMA and 50-day SMA are also trending northward. The relative strength index (RSI) period 14 is at 63 which indicates that the price is in a bullish trend zone.
The views and opinions expressed here do not reflect that of CryptoGlobe.com and do not constitute financial advice. Always do your own research.


