

LTCUSD Medium-term Trend: Bullish
Resistance Levels: $101, $102, $103
Support Levels: $99, $98, $97
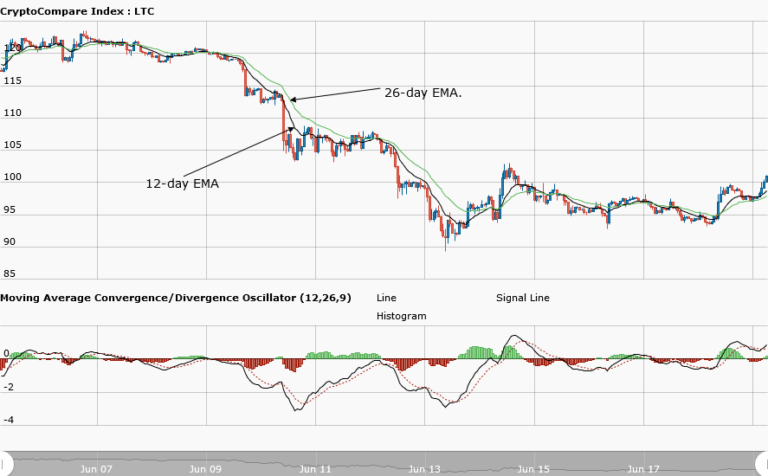
Yesterday, June 18, price of Litecoin made some bullish movement within the confinement of its range-bound zone. The asset rose from its low of $94 to the high of $100 and was resisted. Meanwhile, from the weekly chart, MACD line and the signal line are above the zero line indicating a buy signal. In addition, the price of the asset is above the 12-day EMA and 26-day EMA indicating that the bullish trend is ongoing.
LTCUSD Short-term Trend: Bullish

On the daily chart, price of Litecoin is in a bullish trend. Price of Litecoin rose from the low $94 to the high of $99. It moved again in a range bound to the high of $101. The 20-day moving average and 50-day moving average are trending northward. The relative strength index period 14 is level 70 indicates that the market is overbought suggesting bears to take control of the market.
Then traders are to exit their long trades as the market is said to be overbought. Then, look out for sell setups at the resistance level to place your short trades.
The views and opinions expressed here do not reflect that of CryptoGlobe.com and do not constitute financial advice. Always do your own research..


