

LTCUSD Medium-term Trend: Bearish
Resistance: $95, $96, $197
Support: $93, $92, $91
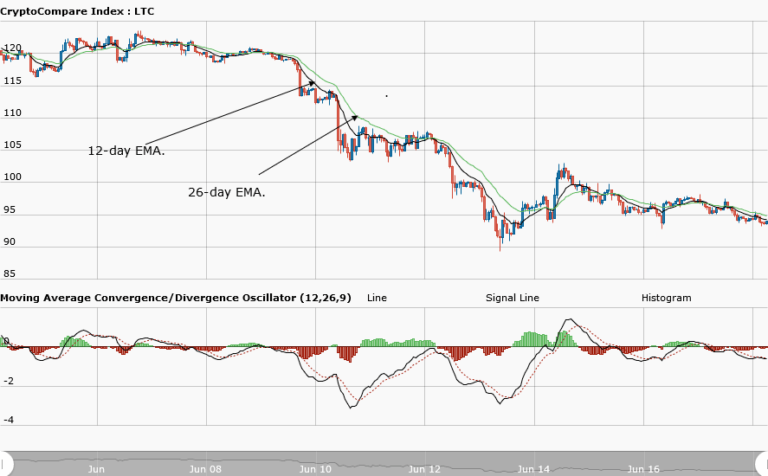
Last week, the Litecoin price was in a bearish trend. The asset traded at $118.95, but depreciated to $96.45 The asset is currently trading above $95 and it is under the bears’ control. The MACD line and the signal line are below the zero line, indicating a sell signal. In addition, the 12-day EMA and 26-day EMA are above the price of the asset, indicating that the bearish pressure will continue.
If the bearish pressure continues, the price will revisit its previous lows and the support levels will be breached. Then traders should look for buy setups to initiate long trades. Nevertheless, if the asset continues its range-bound movement, traders should abstain from trading.
LTCUSD Short-term Trend: Bearish

The daily chart shows the Litecoin price in a bearish trend. The 20-day moving average and 50-day moving average are trending southward. The relative strength index period 14 is level 67, indicating that that price is in a bullish trend zone. The price is expected to rise as the market is said to be oversold.
The views and opinions expressed here do not reflect that of CryptoGlobe.com and do not constitute financial advice. Always do your own research.


