

LTCUSD Medium-term Trend: Bearish
Resistance: $106, $107, $108
Support: $104, $103, $102
Yesterday, the LTCUSD pair traded to the low of $104.44 which was the same as the previous low of February, 2018. From the weekly chart, the support level at $105 had been tested by the bears on more than four occasions. This makes the support level a strong level for the bulls.
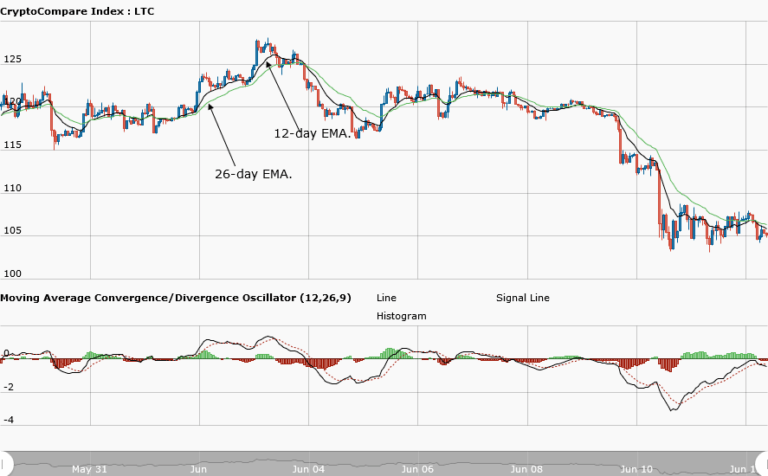
Therefore, I suggest that traders should look for buy setups to enable them place long trades above the support level with a stop loss below it. Meanwhile, the MACD line and the signal line are below the zero line indicating a sell signal for the asset. In addition, the 12-day EMA and the 26-day EMA are neither below nor above the price of Litecoin. This gives us a neutral signal.
LTCUSD Short-term Trend: Bearish

On the daily chart, price of Litecoin is in a bearish trend. On the lower time frame, the MACD line and the signal line are below the zero line which also gives day traders a sell signal.
The views and opinions expressed here do not reflect that of CryptoGlobe.com and do not constitute financial advice. Always do your own research.


