

LTCUSD Medium-term Trend: Bearish
Resistance: $107, $108, $109
Support: $105, $104, $103
Last week, Litecoin was fluctuating between the levels of $117 and $123. However, from the weekly chart, price of Litecoin fell from the high of $118.95 to the low of $104.44. This was the previous low of February 6, 2018. After the downtrend, the asset commenced a range bound movement, Meanwhile, from the weekly chart, the MACD line and the signal line are below the zero line indicating a sell signal. Also, the 12-day EMA and 26-day EMA are above the price of Litecoin indicating that the bearish trend is ongoing.
LTCUSD Short-term Trend: Bearish

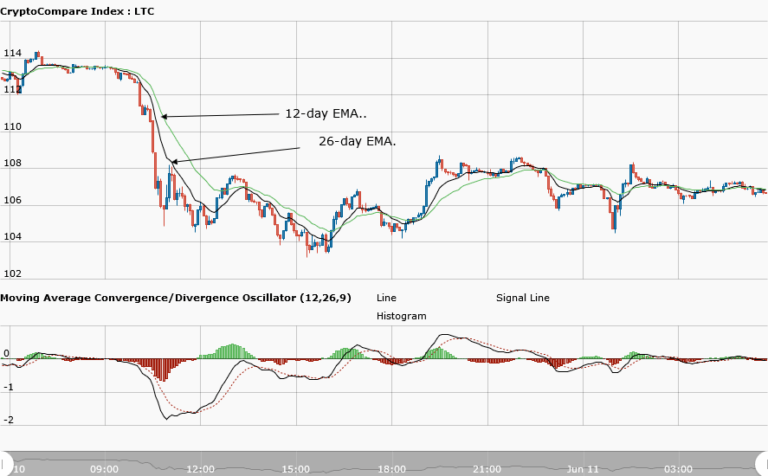
On the daily chart, price of Litecoin is in a bearish trend. At a price of $114, it fell to the low of $104 and resumed a range bound movement. On the daily chart, the MACD line and the signal line are neither above nor below the zero line. In other words, the indicator gives no signal because the asset is ranging. Similarly, the 12-day EMA is neither above nor below the price of the asset. This is because price is neither falling nor rising; the asset is ranging.
The views and opinions expressed here do not reflect that of CryptoGlobe.com and do not constitute financial advice. Always do your own research.


