
LTCUSD Long-term Trend: Bearish
Distribution territories: $140.00, $160.00, $180.00.
Accumulation territories: $65.00, $45.00, $25.00.
LTCUSD hasn’t yet been able to stop the downtrend that’s been affecting it these past few weeks. The market hasn’t been favorable toward a reversal as the bears have been consistently taking the market driving strength from the bulls. Between June 23 and 25, the market’s movement was in a range-bound. Litecoin Charts by TradingView
On June 26 and 27, double bottom Japanese candlesticks were formed but they were slightly surpassed by a bearish Japanese candlestick that occurred on June 28. The price action has now been hovering between price points of $80.00 and $70.00.
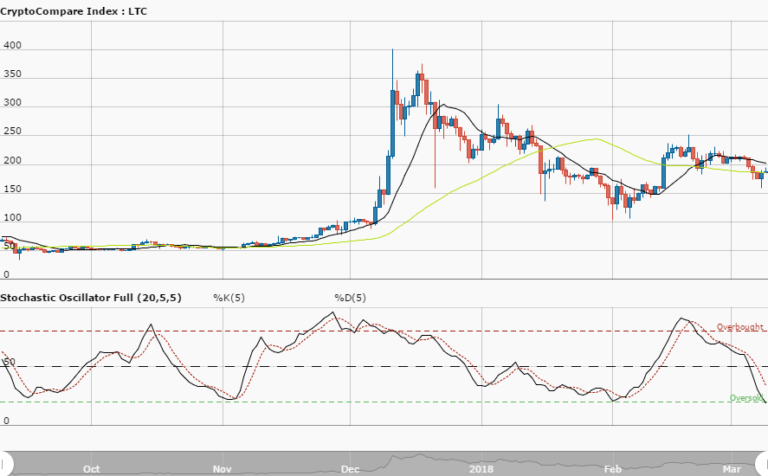
There is a considerable gap between the two SMAs. The 14-day SMA is below the 50-day SMA. Litecoin has been trading below the 14-day SMA’s trend-line. The Stochastic Oscillators have dipped into the oversold region and now point northwards.
This indicates that the bearish trend may soon end. Now, the digital asset may still be driven southward to create short buying opportunities. While that may eventually happen, the bulls can potentially go for an upward breakout in the near future, give the formation of candlesticks below the 14-day SMA’s trend-line.
A sentimental approach deends that sooner than later, a bullish market will prevail as the investors are expected to stage buying positions.
The views and opinions expressed here do not reflect that of CryptoGlobe.com and do not constitute financial advice. Always do your own research.


