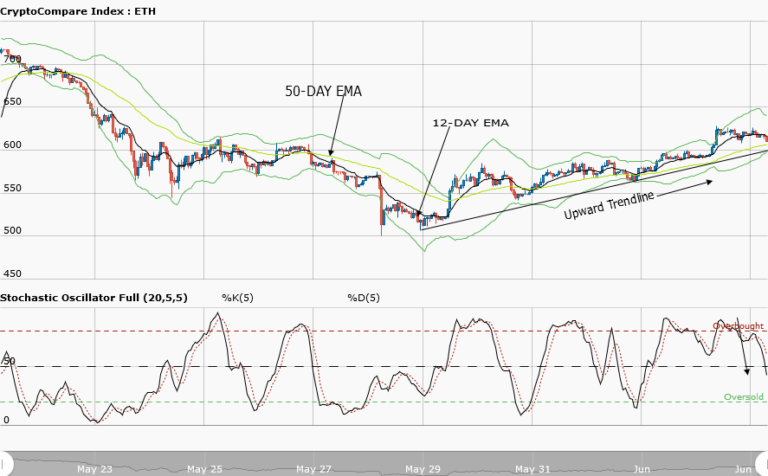
Ethereum Medium-term Trend: Bullish
Supply zones: $650, $750, $800
Demand zones: $550, $500, $450
The bulls continued their takeover of Ethereum in the medium-term outlook. The increase in the momentum of the bulls resulted in the break of the $600.00 supply zone. This was after consolidation over the weekend. The breakout was with a large bullish engulfing candle which justifies the bullish pressure. The price got to the supply area at $605.87 which was a retest of the May 23rd price of the asset. The upward trendline acted as a strong support to the asset each time the bears exerted their pressure. This occurred on May 29th and June 1st. Currently, the bears are more present in the market and as a result the price is being pushed down. The stochastic oscillator is at 47 percent and its signal points down. This also justifies the bears’ pressure. Rejection of further downward push may likely occur at the upward trendline once again. This will set the bulls up for a strong come back for an upward trend continuation. The $650.00 supply zone may likely be the bulls target in the medium term.
Ethereum Short-term Trend: Ranging
Ethereum returns to the range in the short-term outlook. After a nice breakout to the upside, the bulls pushed the price to the $628.00 supply area, breaking the critical supply zone at $600.00. The bears’ presence pushed the price down to the $605.00 demand area. The asset is trading within the upper supply area at $630 and the lower demand area at $600. Traders should be patient as the asset consolidates for a breakout from the upper range to go long or a breakdown at the downside to go short.
The views and opinions expressed here do not reflect that of CryptoGlobe.com and do not constitute financial advice. Always do your own research.


