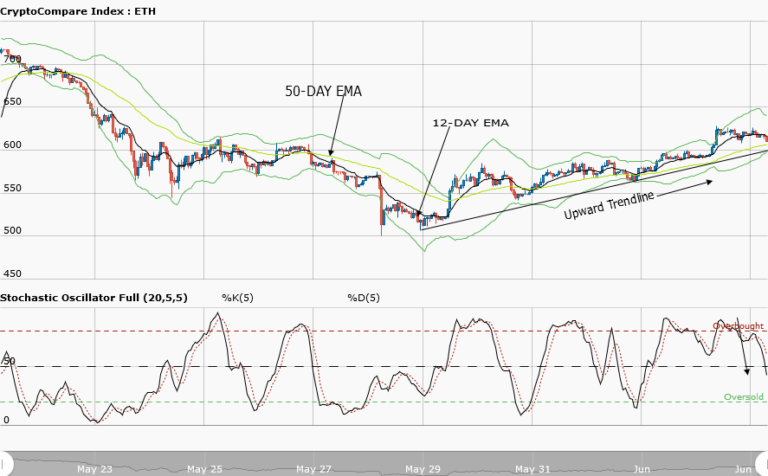
 Ethereum Chart by Trading View
Ethereum Medium-term Trend: Bearish
Supply zones: $550, $600, $650
Demand zones: $350, $300, $250
Ethereum is in bearish trend in the medium-term outlook. The bearish pressure was strong as the cryptocurrency keep making lower highs and lower lowers as you can see from the chart. The break of $420.00 in the demand area of the lower price range coupled with the flag formation are indication of bears’ strong comeback.
The two EMAs are fanned apart which connotes strength in the context of the trend and in this case the downtrend. The stochastic oscillator is in the oversold region at 12 percent and its signals point down which implies downward momentum in price movement of the cryptocurrency as the bears’ pressure increases. The bears’ target in the medium term may be $369.77 in the demand area.
Ethereum short-term Trend: Bearish
 Ethereum Chart by Trading View
The cryptoasset is in bearish trend in the short-term outlook. Price is forming lower highs and lower lows that are characteristics of a bearish market. Price is below the two EMAs crossover and the 10-day EMA is seen acting as strong resistance against bullish movement.
The opening candle is bearish at $433.69 and it closes below the 12-day EMA which indicates bearish pressure in the short-term
The views and opinions expressed here do not reflect that of CryptoGlobe.com and do not constitute financial advice. Always do your own research.


