
Ethereum Medium-term Trend: Ranging
Supply zones: $700, $750, $750
Demand zones: $450, $400, $350
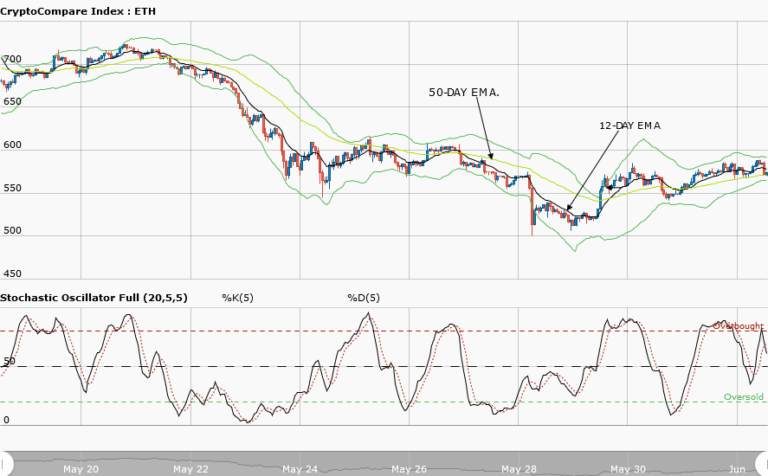
Ethereum goes into consolidation in the medium-term outlook. After a successful ride to $547.94 in the supply area which is also the upper Bollinger band, the momentum of the bull gradually fades. The bears’ strong pressure at this area, broke the two EMAs and pushed the cryptocurrency to $517.36 in the demand area as at the time of writing.
The daily opening candle was bearish at $535.95 and above the 2-EMAs, but was higher than yesterday opening of $517.12. Hence the contention between the bulls and the bears for control. The stochastic oscillator is in the oversold region at 24 percent with signals points down. This implies some downward momentum in price movement.
$550.00 is the upper supply area of range while $500.00 is the lower demand area. Patience will be a good strategy to adopt while the cryptocurrency consolidates to allow for either a breakout or breakdown before taking a position.
Ethereum short-term Trend: Ranging

Ethereum is ranging in the short-term outlook. The bearish run that dropped price from the $530.00 in the supply area to $517.00 in the demand area was lost as you can see that the cryptocurrency enters into consolidation. The stochastic oscillator is in the overbought region with signals pointing down. This means downward momentum in price movement. Ethereum is trading between $527.00 in the upper supply area and $518.00 in the demand area. Traders should wait for a breakout to the upside to go long or a breakdown to the downside to go short.
The views and opinions expressed here do not reflect that of CryptoGlobe.com and do not constitute financial advice. Always do your own research.