

BTCUSD Medium-term Trend: Ranging
Resistance: $7,750, $7,800, $7,850
Support: $7,650, $7,600, $7,550
Yesterday, June 7th, the Bitcoin price was still range-bound between $7,800 and $7,000. The asset has not been able to break the predetermined levels of the market and as a result, a range-bound market strategy was adopted, to trade Bitcoin’s ranging market. Yesterday, Bitcoin was trading above the $7,500 price level. The asset is currently trading at $7,703.
However, the weekly chart shows that the bears are in fierce defiance at the $7,700 resistance level. A powerful bullish breakout will undo the bears’ resistance. On June 3rd, the bulls made an attempt all day to break the resistance level at $7,700, but with no success. Rather, the bears took control and brought the price to $7,400, on June 4th. Today, the bulls are back again at the $7,700 resistance level.
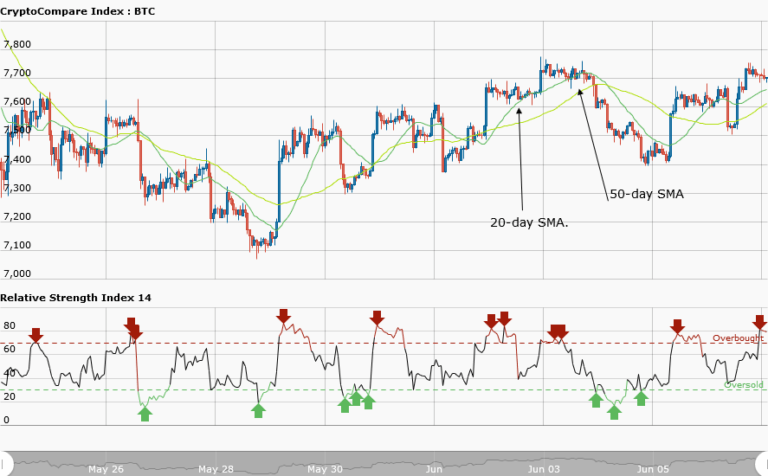
As a trader, if you take a short trade at $7,700 and a stop loss above the $8,000 resistance level, you will make partial profits, if the bears decide to take the price to $7,400. Meanwhile, the relative strength index period 14 is level 81, indicating that the market is overbought and suggesting that the bears will take control of the market.
BTCUSD Short-term Trend: Ranging

The daily chart shows the asset price in a range-bound movement. The asset rose to $7,700 to resume a range-bound movement.
The views and opinions expressed here do not reflect that of BitcoinExhangeGuide.com and do not constitute financial advice. Always do your own research.


