

BTCUSD Medium-term Trend: Ranging
Resistance Levels: $6,150, $6,200, $6,250
Support Levels: $6,000, $5,950, $ 5,900
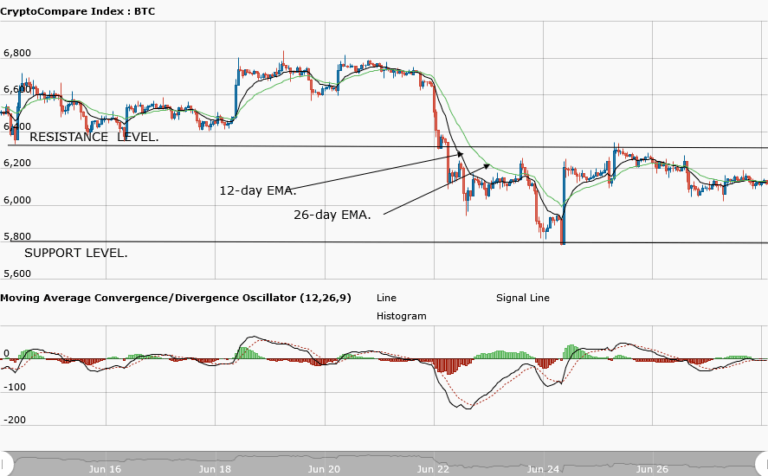
Yesterday, June 27, Bitcoin’s price was in a range bound movement. Today, the range-bound movement continued. The cryptoasset has been fluctuating above the $6,000 price level for four days. From the weekly chart, its price fell to a low of $5,850 on June 24, and made a pullback above the $6,000 price level. It faced resistance at $6,307.
This led to fluctuation between $6,307 and $5,850. Indicators show a neutral signal as the MACD and signal lines are on par with the zero line. The 12- day EMA and 26-day EMA are neither above nor below Bitcoin’s price bars, which indicates that the market is ranging. Traders can adopt a range bound market strategy to trade.
If the price tests the resistance level, a short trade should be taken, with an exit near the support zone. A stop loss should be entered above the resistance level. On the other hand, if the price tests the support level, a long trade should be taken and a stop loss below the support level should be entered. In this case, exit near the resistance level.
BTCUSD Short-term Trend: Ranging

On the daily chart, Bitcoin is range bound at the price of $6,100. The relative strength index period 14 is at 41 which indicates that its price is in the range bound zone.
The views and opinions expressed here do not reflect that of CryptoGlobe.com and do not constitute financial advice. Always do your own research.


