

BTCUSD Medium-term Trend: Bearish
Resistance Levels: $6,400, $6,600, $6,800
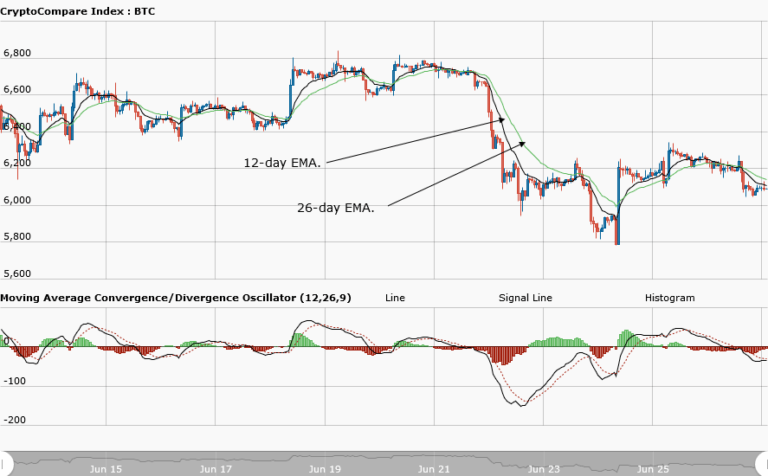
Support Levels: $6,000, $5,800, $ 5,600
Yesterday, June 26, price of Bitcoin was sustained above the $6,000 price level, but there are doubts about how long that would that hold. Now price of Bitcoin fluctuates between the resistance level at $6,307 and the support level at $5,850. If price of the cryptoasset falls and breaks the support level at $ 5,850, then price of Bitcoin will find support around $3,700. Meanwhile, the MACD line and the signal line are below the zero line which indicates a sell signal. Also, the 12-day EMA and the 26-day EMA are above the price bars of Bitcoin suggesting that the bearish trend is ongoing.
BTCUSD Short-term Trend: Ranging

On the daily chart, the cryptoasset was ranging horizontally at a price of $6,200. Later it fell to the support level at $6,050 to resume its range bound movement. Nevertheless, the relative strength index period 14 is level 84 which indicates that the market is overbought suggesting bears to take control of the market.
The views and opinions expressed here do not reflect that of CryptoGlobe.com and do not constitute financial advice. Always do your own research.


