
 Source:Cryptocompare
BTCUSD Medium-term Trend: Bullish
Resistance Levels: $6,400, $6,600, $6,800
Support Levels: $6,000, $5,800, $ 5,600
The BTCUSD pair has sustained its price above $6,000 for the second day running. The cryptoasset had earlier fallen on Sunday, June 24th, to the low of $5,840 before coming back to the previous level above $6,000. If the bulls can sustain their present momentum the price of Bitcoin will reach the highs of $7000 and $7,500.
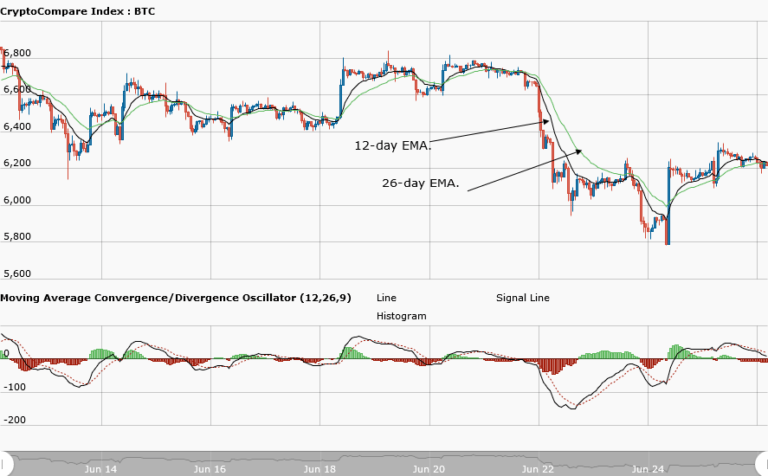
Therefore, if the price of Bitcoin appreciates, traders should look out for buy setups to initiate long trades. Meanwhile, the MACD line and the signal line are above the zero line which indicates a buy signal. Furthermore, the price bars of Bitcoin are above the 12-day EMA and the 26-day EMA suggesting that the bullish trend is ongoing.
BTCUSD Short-term Trend: Ranging

On the daily chart, the price of Bitcoin is ranging at a price of $ 6,300. However, when the cryptoasset had a bullish movement to the high of $6,300, the Bollinger Bands expanded because the market had significant movement and was loud. But when it commenced its range-bound movement, the market contracted and was quiet.
Nevertheless, the relative strength index period 14 is level 58 which indicates that price is in the range bound zone.
The views and opinions expressed here do not reflect that of CryptoGlobe.com and do not constitute financial advice. Always do your own research.


