

BTCUSD Medium-term Trend: Bullish
Resistance Levels: $6,400, $6,600, $6,800
Support Levels: $6,000, $5,900, $ 5,800
The BTCUSD pair had been in a bearish trend all through last week. However, the recent announcement that Tether issued 250 million USDT has injected some unexpected bullish sentiment. Nevertheless, the bullish movement has been stalled by the bears who have taken price into a range bound movement.
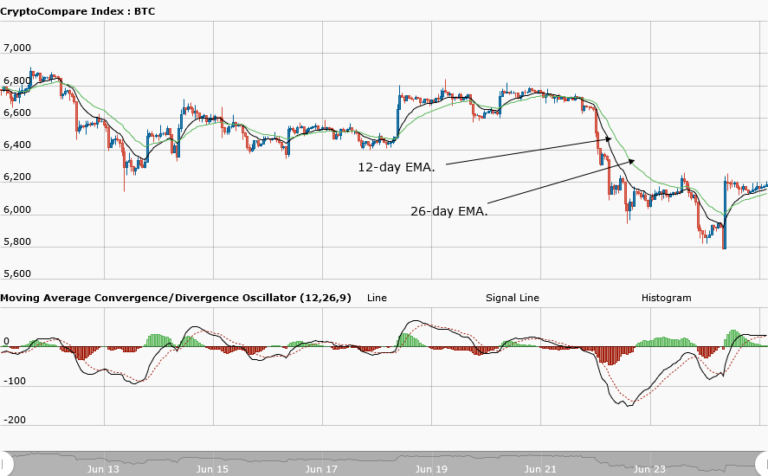
Meanwhile, the MACD line and the signal line are above the zero line which indicates a buy signal. In addition, the price bars of Bitcoin are above the 12-day EMA and the 26-day EMA which indicates that the bullish trend is ongoing.
BTCUSD Short-term Trend: Ranging
 Source: CryptoCompare
On the daily chart, the price of Bitcoin made a bullish movement which led to a range bound movement. As price of the cryptoasset rose higher, the Bollinger Bands expanded meaning that the market was loud. Similarly, as Bitcoin went into a range bound movement, the Bollinger Band contracted meaning that the market was quiet.
Meanwhile, the relative strength index period 14 is level 74 which indicates that the market is overbought suggesting bears to take control of the market. Price of Bitcoin may likely fall below the $6,000 level because the bearish pressure is not over and the market has been overbought.
The views and opinions expressed here do not reflect that of CryptoGlobe.com and do not constitute financial advice. Always do your own research.


