

BTCUSD Medium-term Trend: Bullish
Resistance Levels: $6,650, $6,700, $6,750
Support Levels: $6,550, $6,500, $6,4500
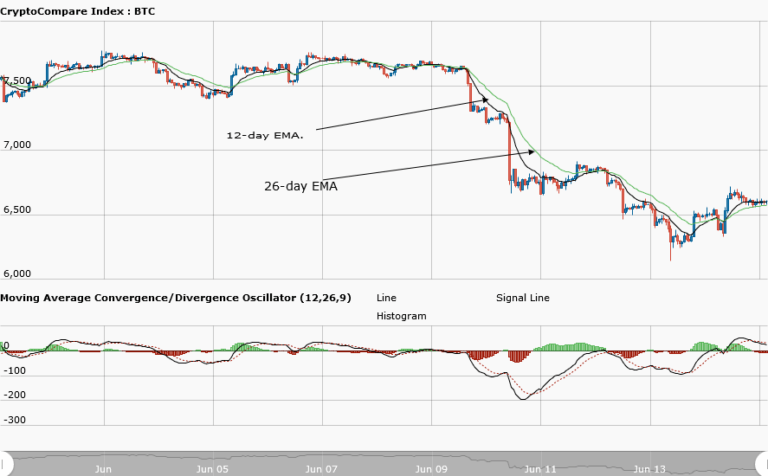
Yesterday, June 14, the BTCUSD pair found its low at $6,225.04 and commenced a bullish movement which eventually broke the bearish trend line and saw a candlestick close on the opposite side of the trend line. The bearish pressure is over and after a bullish movement, the price of the asset is now in a range bound zone. Meanwhile, the MACD line and the signal line are above the zero line, which indicates a buy signal for the asset.
In addition, the price of Bitcoin is above the 12-day EMA and the 26-day EMA which indicates that a bullish trend is ongoing
BTCUSD Short-term Trend: Ranging

On the daily chart, the price of the asset is in a range bound movement. After BTC made a bullish movement from the low of $6,350 to the high of $6,650, it embarked in a range bound movement. The asset is ranging from the support level at $6,550 to the resistance level at $6,650.
Meanwhile, the MACD line and the signal line are at par with the zero line. This is a neutral signal because the asset is ranging. The price of Bitcoin is neither above nor below the 12-day EMA and the 26-day EMA.
The views and opinions expressed here do not reflect that of BitcoinExhangeGuide.com and do not constitute financial advice. Always do your own research.


