

BTCUSD Medium-term Trend: Bearish
Resistance Levels: $6,600, $6,700, $6,800
Support Levels: $6,400, $6,300, $6,200
Yesterday, June 13, price of Bitcoin fell to as low as $6,252.61. Today, the asset is making a bullish movement to the high of $6,488.55.
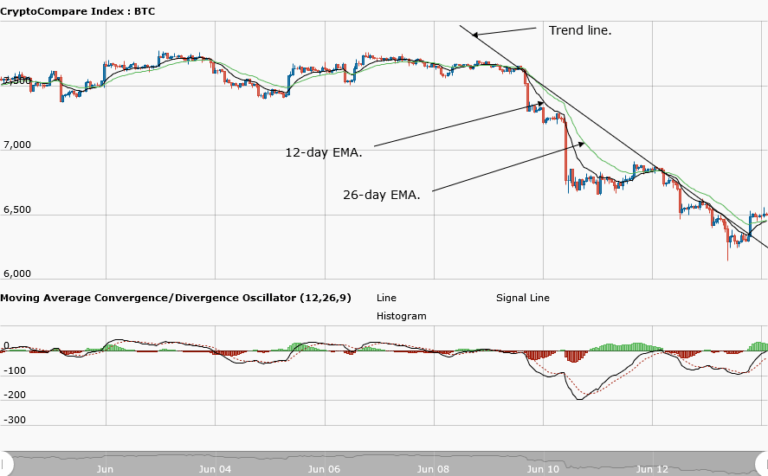
On the whole, the overall trend is bearish. In order to determine the continuity of the bearish trend, a bearish trend line has been drawn. The principle behind this trend line is that if the price of an asset breaks the trend line and the candlestick closed on the opposite side of the trend line; then the current trend is assumed to be reversed. From the chart, price of Bitcoin has broken the trend line and the candlestick closed on the opposite side of it.
In fact, it is now in a range bound movement. It is very likely the bearish pressure is over. Meanwhile, the MACD line and the signal line are below the zero line indicating a sell signal. In addition, the 12-day EMA and the 26-day EMA are neither above nor below the price bars of the asset. This implies that the signal is neutral because the indicator and the price are at par.
BTCUSD Short-term Trend: Bullish

On the daily chart, price of the asset is in a bullish movement. From the daily chart, the MACD line and the signal line are above the zero line indicating a bullish signal. The price of Bitcoin is above the 12-day EMA and the 26-day EMA which indicates a bullish trend is ongoing.
The views and opinions expressed here do not reflect that of CryptoGlobe.com and do not constitute financial advice. Always do your own research.


