

BTCUSD Medium-term Trend: Bearish
Resistance Levels: $6,500, $6,600, $6,700
Support Levels: $6,300, $6,200, $6,100
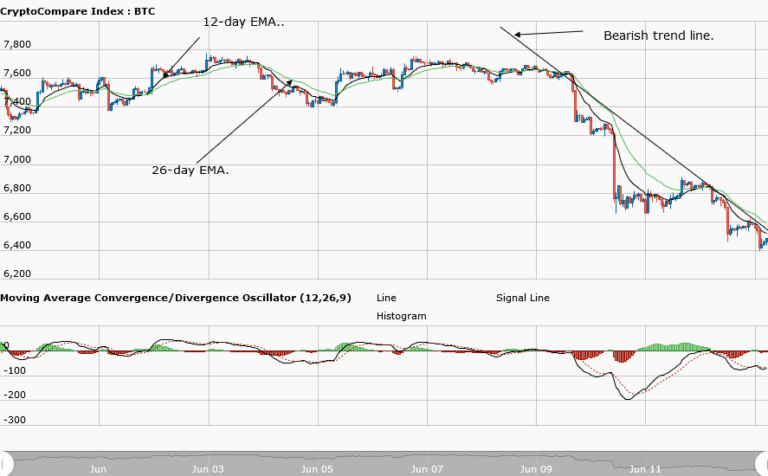
Yesterday, June 12, price of Bitcoin had been fluctuating below and above the price of $6,800. Also, the MACD line and the signal line indicated a sell signal for the price of Bitcoin but were neutral as to the continuity of the bearish trend. Today, price of Bitcoin is in a bearish trend. A bearish trend line is drawn showing the resistance levels of Bitcoin in a downtrend.
The first resistance was at the price of $6,800 where price was consolidating. If you are following the downtrend, a trader could have taken a short trade at the price of $6,800. They could have made partial profits as the price fell to the low of $6,400. There are indications that the asset will reach the low of $6,000. If that is the case, a short trade can be placed at the price of $6,400.
The MACD line and the signal line are below the zero line indicating a sell signal. Also, the 12-day EMA and the 26-day EMA are above the price bars of Bitcoin indicating that bearish trend may continue.
BTCUSD Short-term Trend: Bearish

On the daily chart, price of the asset is in a bearish trend. In this chart, MACD line and the signal line are below the zero line indicating a sell signal for day traders. In addition, the 12-day EMA and the 26-day EMA are neither above nor below the price bars of Bitcoin indicating a neutral signal. The moving averages are at par with the price bars
The views and opinions expressed here do not reflect that of BitcoinExhangeGuide.com and do not constitute financial advice. Always do your own research.


