

BTCUSD Medium-term Trend: Bearish
Resistance: $6,800, $6,900, $7,000
Support: $6,600, $6,500, $6,400
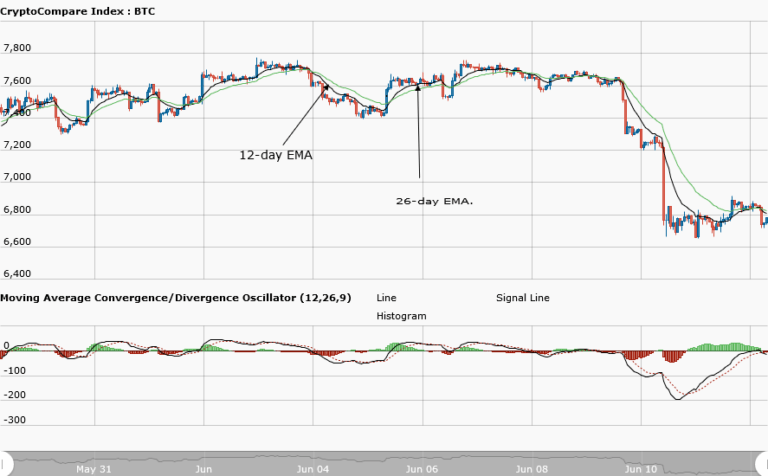
Yesterday, June 11, Price of Bitcoin had a bearish breakout and that was why the asset fell to the low of $ 6,695.32. After the bearish breakout, the asset was trading below and above the $6,800 price level. Meanwhile, the MACD line and the signal line are below the zero line indicating a sell signal for the price of Bitcoin. Also, from the weekly chart, the 12-day EMA and the 26-day EMA are neither above nor below the price of Bitcoin asset.
This is a neutral signal. It implies the asset is fluctuating, the asset is in a range bound movement.
BTCUSD Short-term Trend: Bearish

On the daily chart, price of the asset is in a bearish trend. In the lower time frame, the MACD line and the signal line are below the zero line, this gives us a clear sell signal. Whereas the 12-day EMA and the 26-day EMA are neither below nor above the price of the asset. The exponential moving averages ran are across the price bars. The EMA indicates whether the bearish pressure is ongoing.
The views and opinions expressed here do not reflect that of CryptoGlobe.com and do not constitute financial advice. Always do your own research.


