

BTCUSD Medium-term Trend: Ranging
Resistance: $7,500, $7,550, $7,600
Support: $7,400, $7,350, $7,300
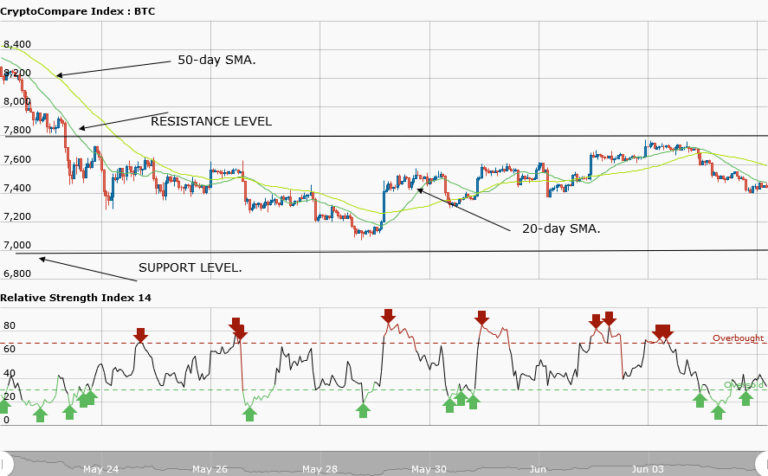
Yesterday, June 4th, the price of Bitcoin had been trading below and above the price of $7,500. When the asset traded above it – it was resisted at $7,613 and would fall to the low of $7,303. However, looking at the weekly chart, the price of Bitcoin is trading below the $7,500 price level. Since May 23rd, when the price of Bitcoin fell to the low of $7,511, it has been fluctuating between the resistance level at $7,800 and the support level at $7,000.
For the last week, the asset has been trading above and below the $7,500 price level. However, whenever an asset falls into a ranging market, a trader should adopt a range bound market strategy to trade the asset. A ranging market is a situation where the direction of price (market) is not certain. We can trade it by adopting a range bound market strategy or breakout trading with the use of pending orders.
The asset will continue with its range bound movement until a possible breakout.
BTCUSD Short-term Trend: Ranging

On the daily chart, the price of Bitcoin is in a ranging market. The asset was ranging at the price of $7,500 but fell to the low of $7,400, and then it continued its range bound movement. Meanwhile, the relative strength index period 14 is level 52 indicating that the price is in the range bound zone.
The views and opinions expressed here do not reflect that of BitcoinExhangeGuide.com and do not constitute financial advice. Always do your own research.


