
BTCUSD Long-term Trend – Bearish
Distribution territories: $9,000.00, $10,000.00, $11,000.00.
Accumulation territories: $5,000.00, $4,000.00, $3,000.00.
Bitcoin was initially in a ranging movement last week but a very strong bearish Japanese candlestick occurred this week. The digital asset started experiencing a southward push on June 10, and soon BTCUSD saw a sudden volatile price decline which saw the cryptocurrency’s price get pushed southward, almost touching the accumulation territory of $6,000.00.
BTCUSD’s action has been trading to a form that may reverse its outlook above the accumulation territory of $6,000.00. The 50-day SMA is currently above the 13-day SMA. The 13-day SMA is still slightly bent southward but the price is currently and slowly averaging northward below the 13-day SMA trend-line.
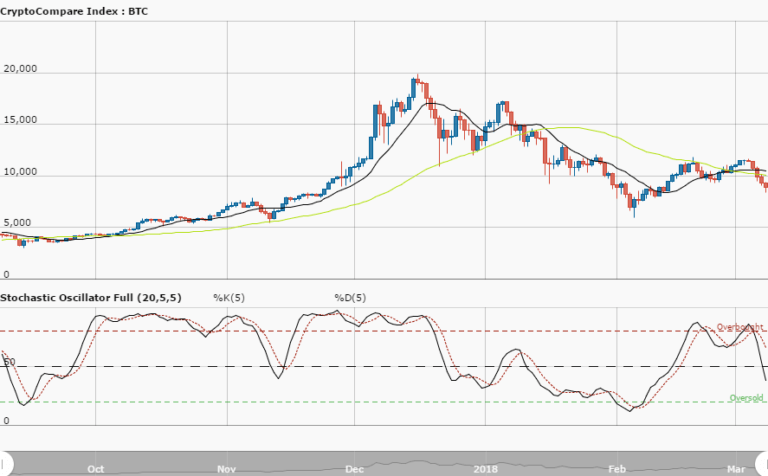
The Stochastic Oscillators have moved past range 20 and are slightly crossed northward. Bearish momentum seems to be accelerating following the failure of BTC to hold above the long-term ascending trend-line which dates back to July 2017. BTC markets have apparently been falling to test the accumulation territory of $6,000.00. Investors can potentially wait for a bullish Japanese candlestick to occur in order to take safe entries in buying the asset.
The views and opinions expressed here do not reflect that of CryptoGlobe.com and do not constitute financial advice. Always do your own research.


