

TRONIX Medium-term Trend: Ranging
Supply zones: $0.08000, $0.09000, $0.1000
Demand zones: $0.0500, $0.0400, $0.0300
Tronix is ranging in the medium-term outlook. The bears lost ground briefly at the $0.056400 demand area as they staged a comeback. The bulls were able to gather enough momentum and pushed the price up to the $0.06732 supply area. The further upward push was rejected as the bears set in again. Their pressure and presence were able to push the price down again, breaking two demand zones at $0.06500 and $0.06000 simultaneously. The price is currently below the three EMA crossover suggesting the bearish pressure returned after a bullish run earlier in the day.
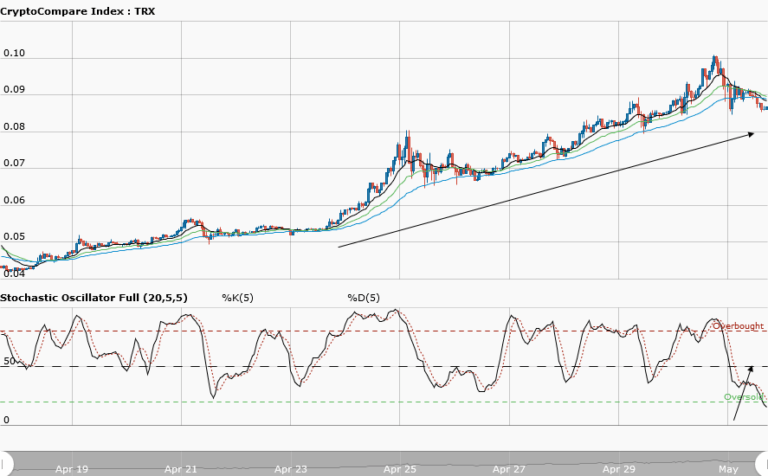
The stochastic oscillator is in the oversold with its signal pointing down, suggesting a downward momentum as the bears’ pressure increases. The pair is trading between the upper supply area at $0.06732 and the lower demand area at $0.056400. The bears may likely bring the price down to the $0.056400 demand area in the medium-term.
TRONIX Short-term Trend: Ranging

Tronix is ranging in the short-term. The journey to the upside was short-lived as the bulls lost momentum at the $0.06800 supply area. The bears came in with an increased momentum and the price was pushed down to the demand area at $0.05900. The struggle between the bulls and the bears continue over the market dominance. The pair is ranging between the upper supply area at $0.06800 and the lower demand area at $0.05900. Traders should wait for a breakout to the upside or a breakdown to the downside before taking a position.
The views and opinions expressed here do not reflect that of CryptoGlobe.com and do not constitute financial advice. Always do your own research.


