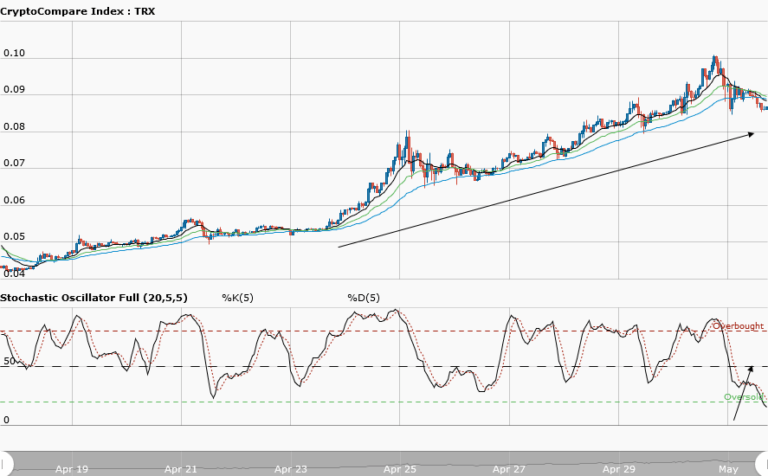
TRONIX Medium-term Trend: Bearish
Supply zones: $0.08000, $0.09000, $0.1000
Demand zones: $0.0500, $0.0400, $0.0300
Tronix continues its bearish trend in the medium-term outlook. The bears held tight to the market as they broke the strong demand zones pushing the price further south. Indeed the $0.06500 demand zone predicted yesterday for a retest was achieved and the $0.06000 demand zone was also broken, reaching a fresh demand area at $0.056400. The upward price move was rejected at the 12-day EMA that acted as a strong resistance. The daily candle opened bearish below the three EMAs, also the three EMAs are fanned apart. This implies more seller presence and strength in the context of the trend. In this scenario, the downtrend is valid as the downward trendline from the chart attests to this. The stochastic oscillator is in the oversold region but was rejected for upward momentum.This means that the downward momentum in price will continue.$0.0500 may likely be the bears’ target in the medium-term.
TRONIX Short-term Trend: Bearish
Tronix is bearish in the short-term. The journey to the downside was smooth as the bears broke the lower demand area of yesterday’s range. The bears’ broke the lower range retested it and took the price on a free fall to $0.05600 demand area. You can see a double bottom formation in this area. This is a reversal pattern – with the bulls pushing up the price. The bulls activities should be seen as pullbacks for the market correction for downtrend continuation. Two downward trendlines were drawn in the chart. You will notice rejection to the upside at the second trendline. Likewise, the bullish momentum may likely see rejection as it touches this trendline.
The views and opinions expressed here do not reflect that of CryptoGlobe.com and do not constitute financial advice. Always do your own research.


