

TRONIX Medium-term Trend: Bullish
Supply zones: $0.08000, $0.09000, $0.1000
Demand zones: $0.0500, $0.0400, $0.0300
Tronix remains bullish in the medium-term outlook. An upward bullish rejection was seen at the $0.07200 supply area. This brought the bears back and pushed the price down to the demand area at $0.06800 above the upward trendline.
The wave 5 of the Elliot waves is still playing out well. This implies that the price may go higher. Tronix is in a bullish pennant. In this type of scenario, the uptrend is favored. The price makes highs and lows within the wedge until a breakout occurs.
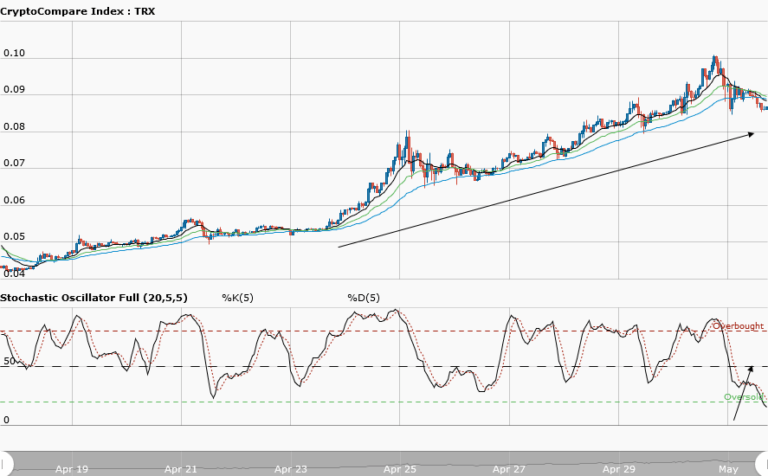
Daily candles opened bearish at $0.07187 and the stochastic oscillator has left the overbought region and its signal is pointing down. These all imply that some downward momentum in the price may be seen as the bears exercise some pressure. This should suggest a market correction for uptrend continuation in the medium term.
TRONIX Short-term Trend: Ranging

Tronix is going into consolidation in the short-term. The bears’ pressure that brought its price to the demand zone at $0.06700 is reducing, as the bulls’ intervention at this zone dragged the price up once again. The $0.07300 supply zone was a point where the bears came in again.
Tronix is trading between the upper supply range of $0.07300 and the $0.06700 lower demand range. Traders should be patient to allow the pair to define its trend by either a breakout to the upside or a breakdown to the downside before taking any position.
The views and opinions expressed here do not reflect that of CryptoGlobe.com and do not constitute financial advice. Always do your own research.


