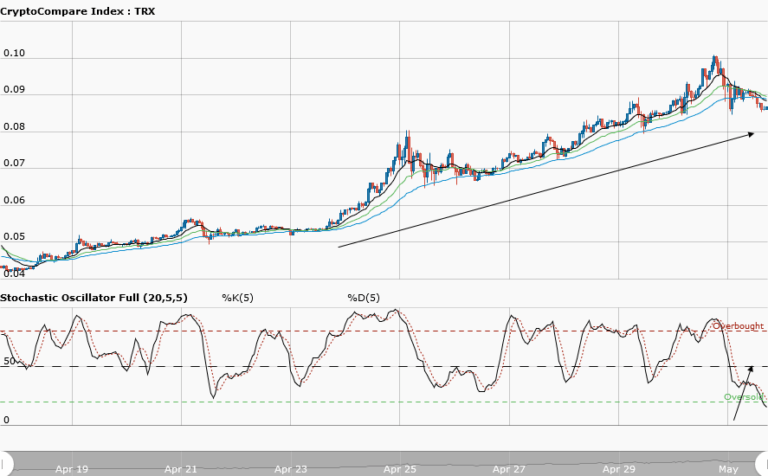
TRONIX Medium-term Trend: Bearish
Supply zones: $0.08000, $0.09000, $0.1000
Demand zones: $0.0500, $0.0400, $0.0300
Tronix is bearish in the medium-term. The bulls failure to step up momentum at the $0.08000 supply area led to the bears’ strong comeback. This led to a downward price movement, first to the $0.07500 demand area and finally at $0.07000 demand area. You can see the rejection of the bullish comeback around the 12-day EMA that acted as strong resistance. The price is below the three moving averages crossover. THe daily candle opened bearish at $0.07261 as against yesterday’s opening of $0.08077. This all points to the bears’ presence and pressure. The stochastic oscillator shows upward momentum rejection which conversely means downward price movement as the bears’ pressure increases. In the medium-term, the $0.06000 may be the bears’ target.
TRONIX Short-term Trend: Bearish
Tronix is bearish in the short-term. Patience during consolidation is key to a good ride of the market as the bears broke the lower demand range of yesterday’s analysis. The bears successfully pushed the price down to the $0.07000 demand zone. They overcame the bulls’ attempt of coming back at key supply areas. You can see that at $0.07500 supply area in the chart, the bulls made three attempts to breakout but they were rejected, thus leading to the formation of triple top scenarios. The price is forming lower highs and lower lows that are downtrend characteristic. As more bearish candles formed and closed below the three EMAs we are likely to see more of this.
The views and opinions expressed here do not reflect that of CryptoGlobe.com and do not constitute financial advice. Always do your own research.


