
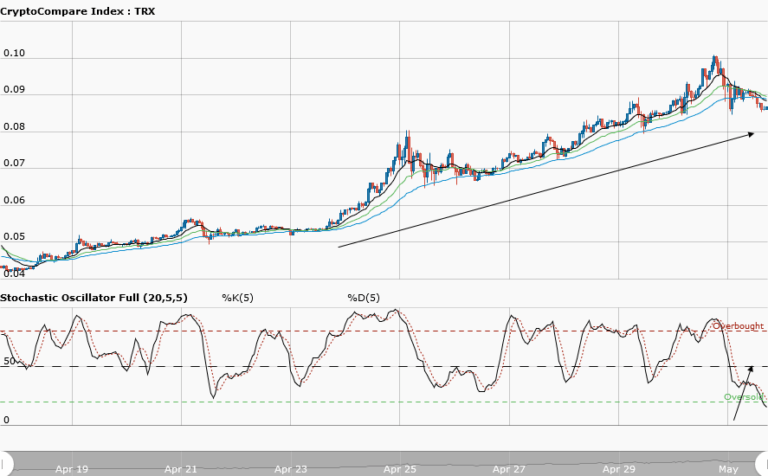

TRONIX Medium-term Trend: Bullish
Supply zones: $0.09000, $0.1000, $0.1100
Demand zones: $0.0500, $0.0400, $0.0300
Tronix remains bullish in the medium-term. The bulls are still dominating the market despite the bears’ sudden appearance. The bears succeeded in pushing the price to the $0.07700 demand area twice to give a double bottom formation which is an indication of a trend reversal. This is around the 12 and 26 moving averages as you can see from the chart. The drawdown is at 50 percent fib level. This implies more buyers are likely to come back and for the uptrend continuation to resume. Interestingly the price is above the 50 EMA. This is still a buyers’ arena- so more buying may occur in the medium term. The stochastic oscillator in the oversold region with the signal up -meaning upward momentum by the bears as they push price up north.
TRONIX Short-term Trend: Ranging

Tronix goes into consolidation in the short-term. The bulls managed to the push price up to the $0.08300 supply zones, but lost momentum and the bears took over. The bears’ pressure saw the price down to the $0.07700 demand area before the bulls took over again. The battle continues between the bulls and the bears within the range. $0.08300 is the upper supply range while $0.07800 is the lower demand range. Patience will be a strategy to adopt as Tronix goes into consolidation in the short-term to allow for either a breakout or breakdown at the range levels before taking a position.
The views and opinions expressed here do not reflect that of CryptoGlobe.com and do not constitute financial advice. Always do your own research.


