

TRONIX Medium-term Trend: Bullish
Supply zones: $0.09000, $0.1000, $0.1100
Demand zones: $0.0500, $0.0400, $0.0300
Tronix remains bullish in the medium-term. The strong bearish pressure that started on April 30 at the $0.10000 supply zone gradually faded away on May 12, at the $0.05900 demand area.
This was with a nice bullish pinbar and long bullish engulfing candle. Bearish efforts to bring the price back to a demand area failed as the bulls gathered momentum. The momentum was strong on May 20, when they pushed the price above the moving average crossover and sustained the tempo.
The 12-dya EMA was a strong resistance against the bears’ pressure as the price did not go past it. Daily candles opened at $0.07717, above the moving averages crossover. The EMAs are fanned apart which suggest strength in the context of the trend and in this case the uptrend. A minor pullback may occur but there is confirmation for an uptrend continuation. The bulls’ target is likely a retest of the $0.08500 supply area in the medium term.
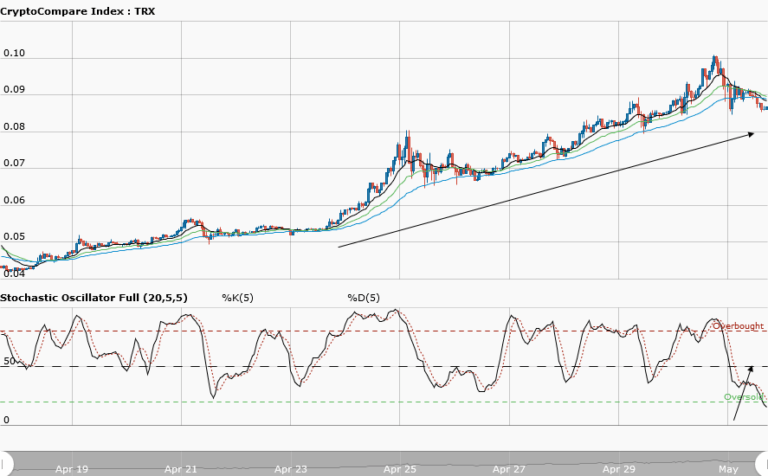
TRONIX Short-term Trend: Bullish

Tronix is bullish in the short-term. The bulls’ supremacy was established, as a breakout from the upper supply area of $0.07000 range was achieved. Bearish momentum faded away at $0.07200 as the bulls continued to push the price higher. It went past the $0.08400 supply zones.
A pullback was seen as the bears staged a comeback pushing to the $0.08100 demand area. The is forming higher highs and higher lows which are an uptrend characteristic. As more bullish candles are formed and closed above the moving averages crossover, new highs at $0.08600 supply area may be seen in the short-term
The views and opinions expressed here do not reflect that of CryptoGlobe.com and do not constitute financial advice. Always do your own research.


