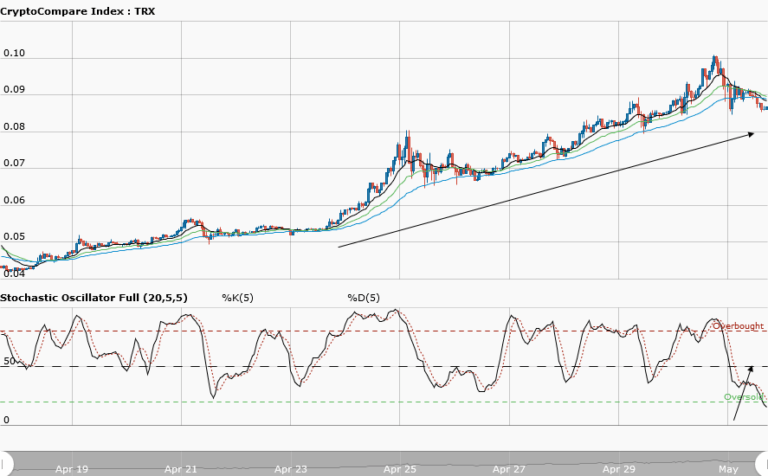
TRONIX Medium-term Trend: Bearish
Supply zones: $0.07000, $0.08000, $0.09000
Demand zones: $0.0500, $0.0400, $0.0300
Tronix‘s bearish trend continues in the medium-term. The market is being dictated by the bears as they continue to push the price further down, breaking major demand zones. We see a bounce off the trendline each time the bulls pushed the price to the trendline. The bears’ pressure was strong as they broke through two demand zones at $0.07000 and $0.06500. The daily candle opened bearish and below the three exponential moving averages crossovers. This implies that a more bearish momentum and price may be pushed further down. The three moving averages are fanned apart. This suggests a strength in the context of the trend, in this case, the downtrend. We see a rejection to the upside momentum in the stochastic oscillator. This means a downward momentum continuation. The bears’ target is likely the $0.06000 demand zone in the medium-term.
TRONIX Short-term Trend: Bearish
Tronix returns bearish in the short-term. The bulls lost momentum at the $0.08000 supply area and this set up the bears for a strong comeback and dragged the price down south after breaking out of the lower price range of $0.07900. Major demand zones at $0.07000 and $0.06500 were nicely broken. Tronix gives lower highs and lower lows which are characteristics of a down trending market. the daily price opened at $0.07521, lower than yesterday’s opening at $0.08288. This suggests more sellers are back in the market. A further downward push is more likely as more bearish candles formed and closed below the three exponential moving averages crossover.
The views and opinions expressed here do not reflect that of CryptoGlobe.com and do not constitute financial advice. Always do your own research.


