

TRONIX Medium-term Trend: Bearish
Supply zones: $0.09000, $0.1000, $0.1100
Demand zones: $0.0500, $0.0400, $0.0300
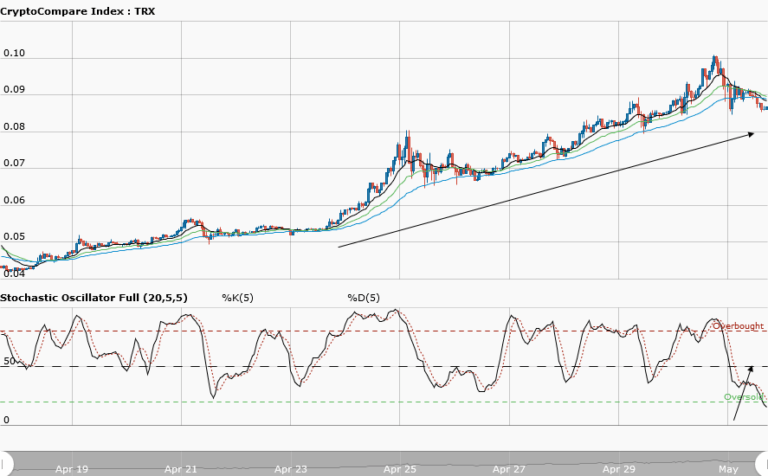
Tronix‘s bearish trend continues in the medium-term. The bears kept control of the market despite the bulls’ attempt. The bulls tried to change the game as they pushed the price up from the $0.07808 demand area to the $0.08139 supply area. The strong bullish rejection that resulted saw the bears dragging the price back to the $0.07987 demand area. The 50 exponential moving average serves as a good resistance to the price’s upward push. The price did not get to the downward trendline yesterday as a result of the bears’ pressure, as seen from the chart. The stochastic oscillator is pointing down after it was rejected for an upward momentum. Further bearish candles formation may continue as the sellers keep pushing the price down.
TRONIX Short-term Trend: Ranging

Tronix is consolidating in the short-term. The bullish comeback that drove the price up from the $0.07900 demand area to the $0.08200 supply area was short-lived. The double top formation at this supply area brought in the bears. Their activities pushed the price down back to the $0.07900 demand area. Tronix is trading within the upper range of $0.0820 and the lower one of $0.07900. Caution should be exercised when trading the range. This is because a breakout or breakdown could happen anytime.
The views and opinions expressed here do not reflect that of CryptoGlobe.com and do not constitute financial advice. Always do your own research.


