
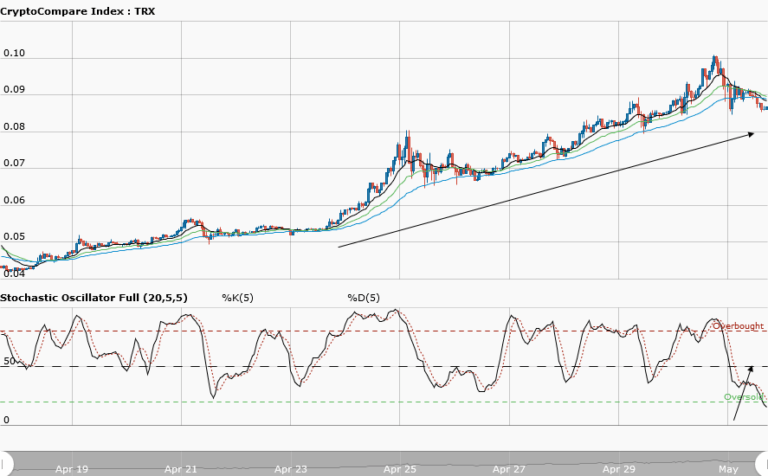

TRONIX Medium-term Trend: Bullish
Supply zones: $0.0900, $0.1000, $0.1100
Demand zones: $0.0500, $0.0400, $0.0300
The bulls still dominate Tronix‘s medium-term outlook. The bullish run was a nice journey, as it was a retest of Jan 18th supply zone. The bears’ impact at the $0.1003 supply area is much expected and pushed the price to the $0. 08500 demand area. The pullback that is currently happening is necessary for the market correction. This will provide another opportunity for more buyers to take Tronix to a new supply area. The Stochastic Oscillator is in the oversold area, as more bullish candles formed and closed above the three moving average crossovers; a change in the signal of the stochastic will point upward, confirming the upward momentum.
TRONIX Short-term Trend: Ranging

Tronix is in a range in the short-term outlook. The pair is trading within the $0.1000-$0.0850.bracket. $0.0850 is a strong demand area as we see buying pressure in this area. As more buyers come back into the market, Tronix is likely to test the $0.0900 supply area. This will clear the way for a retest of the $0.1000 supply area. Traders should buy within the demand area as they trade within the range. This is because the overall outlook is bullish.
The views and opinions expressed here do not reflect that of CryptoGlobe.com and do not constitute financial advice. Always do your own research.


