
TRXUSD Long-term Trend: Bearish
Supply zone: $0.9000, $0.1000, $0.1100
Demand zone: $0.0500, $0.0400, $0.0300
Tronix’s long-term outlook remains bearish. The bulls made a frantic effort to stage a comeback after the price was pushed to the $0.05900 supply area. This upward move was rejected by the bears with the formation of a bearish doji at the $0.07590 supply area below the 50-day EMA.
This led the price down, as it made another low at $0.06252 with a nice bullish pin bar. This helped the bulls get back on the market, but it was short-lived with a rejection again at the 50-day EMA with a bearish hammer. Rejection of upward moves at the EMAs’ area was predicted in last week’s long-term Tronix price analysis. It will also be seen this week.

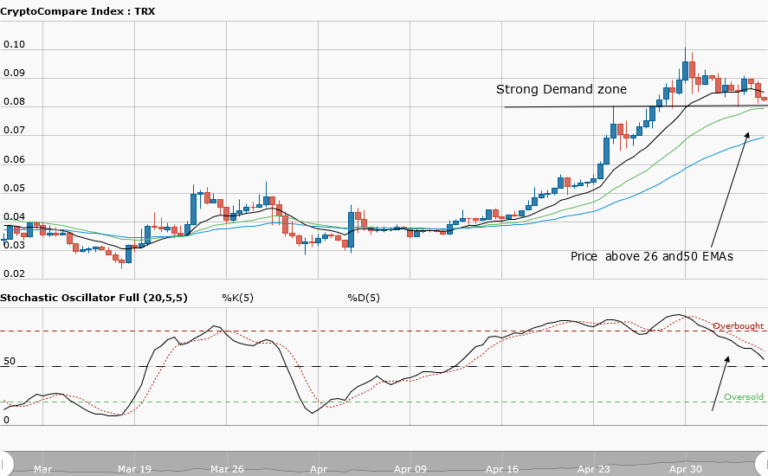
From the chart above, we can see that the pair forms a bearish railroad on the 12-day EMA. This area is a seller arena and thus implies that the bears’ pressure is likely going to increase in the week ahead. The Stochastic Oscillator is in the oversold region, which implies that some bullish momentum may be seen, but this may likely be a pullback for further downtrend continuation.
The views and opinions expressed here do not reflect that of CryptoGlobe.com and do not constitute financial advice. Always do your own research.


