
TRXUSD Long-term Trend: Bearish
Supply zone: $0.9000, $0.1000, $0.1100
Demand zone: $0.0500, $0.0400, $0.0300
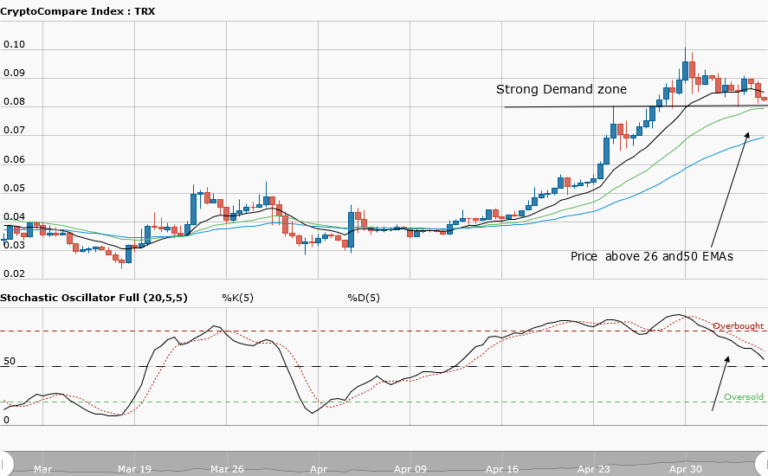
Tronix’s long-term outlook is once again bearish. The bullish run from April 8 kept gradually fading until April 30, with the bearish railway track formation. The price was pushed high to the $0.10000 supply zone for the bulls but they lost control of the market to the bears.
The bears’ pressure was strong as they broke key demand zones at $0.09000, $0.08000, $0.07000 and $0.06000. The cryptocurrency’s is below the EMAs, which connotes bearish pressure. The formation of a bullish railway means that the bulls are gradually coming back.

The Stochastic Oscillator is in the oversold region with its signal pointing up. This shows upward momentum. A bullish move will be seen in Tronix as the week goes by, but this is likely a pullback for downtrend continuation. Rejection at the EMAs and key supply zones is probable
The views and opinions expressed here do not reflect that of CryptoGlobe.com and do not constitute financial advice. Always do your own research.


