

XRPUSD Medium-term Trend: Bearish
Supply Levels: $0.80, $0.79, $ 0.78
Demand levels: $0.74, $0.75, $0.76
Yesterday, March 8, Ripple price was found in the range-bound zone again between $0.80 and $0.90 before the previous bullish breakout at the same level on April 30. Ripple price reached $0.93 and was resisted by the bears who brought it to the range bound zone. It was assumed that if the price broke the support level at $0.80, Ripple would find support at $0.77.
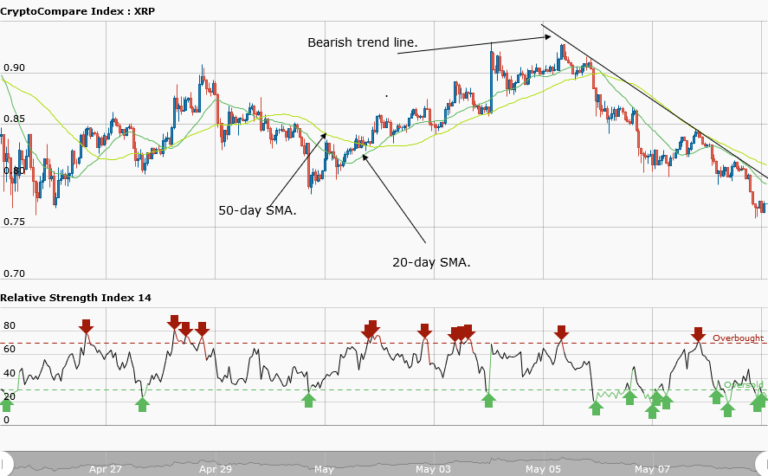
On the other hand, if the Bulls sustain a hold on the $0.80 level, Ripple will revisit the $0.90 high. Nevertheless, Ripple price actually broke the support level at $0.80 and fell to the $0.77 low. On the chart, a bearish trend line is drawn, showing the downtrend of Ripple. The bearish trend line overlaps the price bars.
When the price pulls back and touches the trend line a resistance level is created and that invariably gives us a seill signal. Traders ought to take short trades at those resistance levels.
XRPUSD Short-term Trend: Bearish

The daily chart shows Ripple price is in a smooth downtrend. A bearish trend line is drawn from $0.83, showing the resistance levels where traders can take short trades. Also, the 20-day and 50-day moving averages are trending southward indicating the downtrend.
The views and opinions expressed here do not reflect that of CryptoGlobe.com and do not constitute financial advice. Always do your own research.


