

XRPUSD Medium-term Trend: Ranging
Supply Levels: $0.83, $0.82, $ 0.81
Demand levels: $0.77, $0.78, $0.79
Yesterday March 7 the price of Ripple had broken the bullish trend line resulting in the reversal of the bullish trend. The price of the asset was expected to rise to reach the highs of the previous levels. On the other hand, it was assumed that if the price of the asset breaks the support level at $0.80, Ripple will find support at $0.77. Meanwhile, the XRPUSD pair is currently trading at $0.80 as at the time of writing. However, looking at the weekly chart, Ripple is now trading at $0.80 as at today. But this was the previous low Ripple had on April 30, 2018. From this price it rose to $0.93 on May 5, then nosedived again to its previous low at $0.80 on May 8. The resistance level at $0.90 and the support level at $0.80 were the previous levels of Ripple before the bullish breakout. Now if the price breaks the support level at $0.80, Ripple will find support at $0.77. However, if the Bulls sustain a hold on the price at that level, the asset retests the resistance level at $0.90
XRPUSD Short-term Trend: Ranging

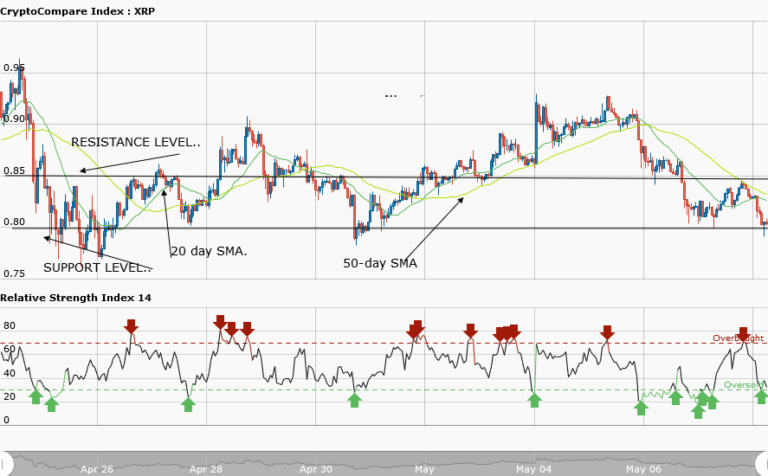
In the daily chart, the price of Ripple was also in a range bound movement. At a price of $0.80, it made a bullish movement to the high of $0.84, and then pulled back to the low of $0.82. Fromom the price of $0.82 it rose again to the high of $0.84 and made a final pull back to the low of $0.80.
The views and opinions expressed here do not reflect that of CryptoGlobe.com and do not constitute financial advice. Always do your own research.


