

XRPUSD Medium-term Trend: Ranging
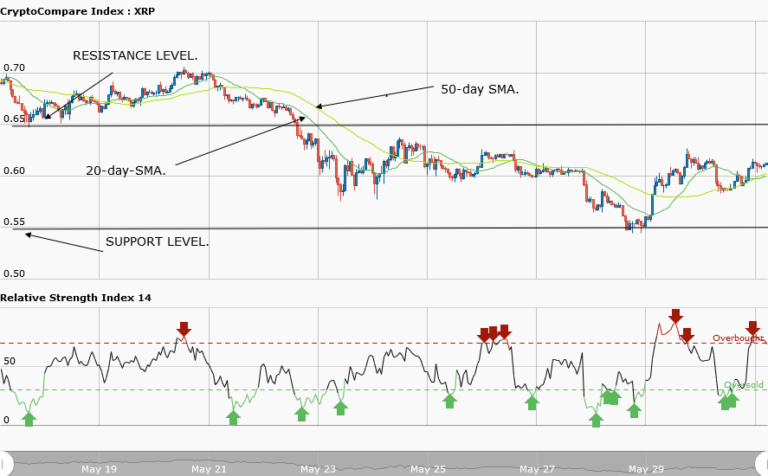
Supply Levels: $0.75, $0.70, $ 0.65
Demand levels: $0.45, $0.50, $0.55
Yesterday, 30 May, the Ripple asset had a bullish breakout at $0.60 resistance. The price also broke the bearish trend line indicating that the bearish pressure might have ended. It was also assumed that the Ripple price might reach $0.65 if the resistance level at $0.62 was broken. Today, Ripple was trading at $0.61 at the time of writing.
However, the weekly chart shows that the price has been range-bound between the resistance level at $0.65 and the support level at $0.55. This was because the price was resisted at $0.62 and at $0.59. Ripple was fluctuating below and above $0.60. Now, if the price breaks the resistance level at $0.62, it will reach $0.65.
However, if the price breaks the $0.59 support level, it will fall to $0.55.
XRPUSD Short-term Trend: Ranging

The daily chart shows Ripple in a ranging market. The price of the asset fell from $0.61 to $0.58. Later, the asset resumed its range bound movement and rose to the upward. However, as the price of the asset is range-bound, a breakout is imminent.
The views and opinions expressed here do not reflect that of CryptoGlobe.com and do not constitute financial advice. Always do your own research.


