

XRPUSD Medium-term Trend: Bullish
Supply Levels: $0.64, $0.63, $ 0.62
Demand levels: $0.58, $0.59, $0.60
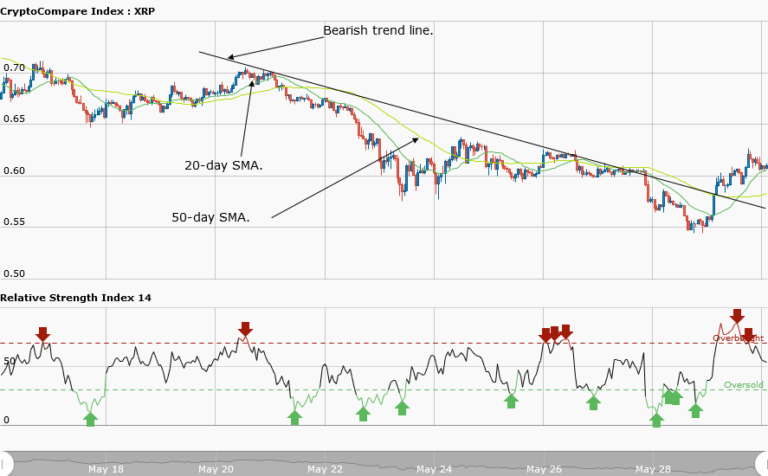
The XRPUSD pair was also in a bearish market. On 28 May, the Ripple price fell to $0.55 and the asset went into a range-bound movement for two days. The range-bound movement resulted in a bullish trend. Ripple was trading at $0.61 at the time of writing. The weekly chart shows the price in a bullish trend, breaking broke the resistance level at $0.60.
The asset price also broke the bearish trend line and the candlestick closed at the opposite of the trend line, indicating a reversal of price. Ripple is now trading above $0.60 and it is likely that the asset will reach $0.65 if it overcomes the resistance at $ 0.62. The relative strength index period 14 is level 68 indicating that the price is in the bullish trend zone.
XRPUSD Short-term Trend: Bullish

The daily chart shows Ripple in a smooth uptrend. The price is making a series of higher highs and higher lows. A bullish trend line is drawn, showing the support levels where you can place your long trades. The arrow points to the support level where you can place your long trades.
The views and opinions expressed here do not reflect that of CryptoGlobe.com and do not constitute financial advice. Always do your own research.


