

XRPUSD Medium-term Trend: Ranging
Supply Levels: $0.88, $0.87, $ 0.86
Demand levels: $0.82, $0.83, $0.84
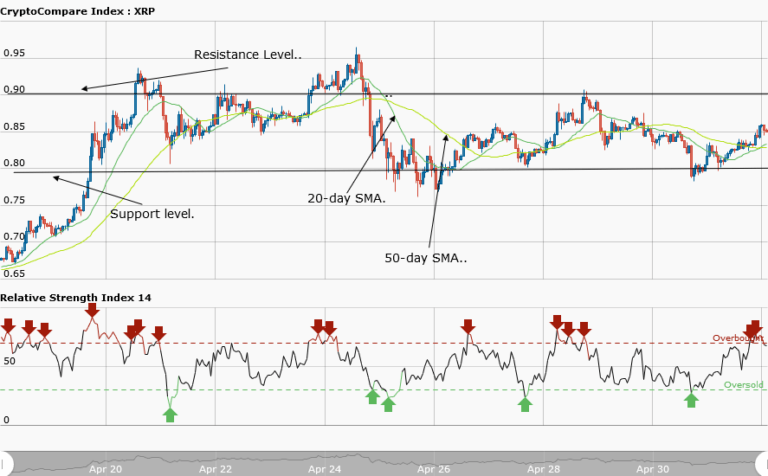
The Ripple digital currency remained range bound yesterday between the resistance level at $0.90 and the support level at $0.80. Ripple has been hovering over these key levels. On April 20, the bulls took price of Ripple to the high of $0.93 but the bears resisted and brought it below the resistance level.
Since then the price of Ripple has been in a range bound movement. Ripple is currently trading at $0.85 as at the time of writing. However, if the bulls break the resistance level at $0.90, price of Ripple will likely revisit the highs of $1.10 and $1.22.
XRPUSD Short-term Trend: Bullish

In the daily chart, price of Ripple is in a smooth uptrend. The bullish trend line shows the support levels with pointed arrows where traders can initiate long orders, in a bullish market. The 20-day moving average is above the 50-day moving average indicating that price of the asset is rising.
The views and opinions expressed here do not reflect that of CryptoGlobe.com and do not constitute financial advice. Always do your own research.


