

XRPUSD Medium-term Trend: Bearish
Supply Levels: $0.70, $0.69, $ 0.68
Demand levels: $0.64, $0.65, $0.66
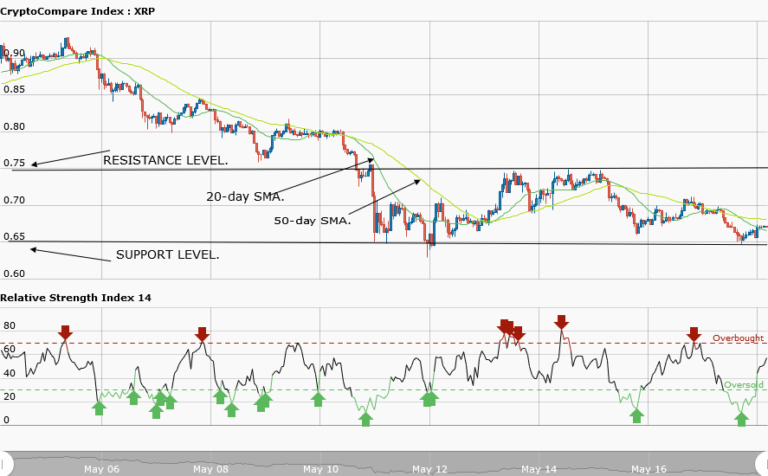
Yesterday, May 17, Ripple price was trading below $0.70. The weekly chart shows that the price tested the resistance level of $0.75 and the support level at $0.65, without breaking them. Based on this, It was assumed that the possibility of a breakout was imminent . Today, Ripple price was trading at $0.67 at the time of writing.
The weekly chart shows that the price tested the support level at $0.65 for the fourth time and was unable to break it. At other times, Ripple came close to breaking it. A breakout at the $0.65 support level will take Ripple to the $0.56 low. The price will continue its range-bound movement if the bears are unable to break the level. Meanwhile, the relative strength index period 14 is level 57, indicating that the price is in the range-bound zone.
XRPUSD Short-term Trend: Ranging

The daily chart shows that the price was ranging at $0.69 before it fell to the $0.65 and it resumed its range bound movement.
The views and opinions expressed here do not reflect that of CryptoGlobe.com and do not constitute financial advice. Always do your own research.


