

XRPUSD Medium-term Trend: Bearish
Supply Levels: $0.74, $0.72, $ 0.70
Demand levels: $0.62, $0.64, $0.66
Yesterday, Ripple price was ranging from the support level at $0.70 to the resistance level at $75. It was assumed that the asset price is likely to break any of the levels, as the market is range-bound. Today, Ripple price was trading at $0.67 at the time of writing. However, the weekly chart shows that Ripple had a bearish breakout and the price is approaching the $0.65 low.
However, if the bulls fail to hold the bearish move at the support of $0.65, the price will slide to $0.60 and $0.56. Nevertheless, the support level at $0.65 is a strong support level because it has been tested three times. If the bulls take control of the market, traders should place long trades at the support level, while putting a stop loss at $0.60.
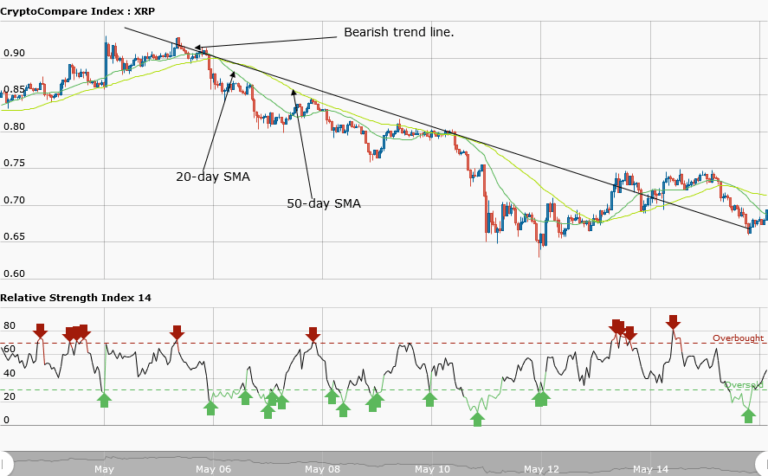
XRPUSD Short-term Trend: Bearish

The daily chart shows Ripple price in a bearish market. The asset price is also in a smooth downtrend and fell from $0.74 to $0.66.
The views and opinions expressed here do not reflect that of CryptoGlobe.com and do not constitute financial advice. Always do your own research.


