

LTCUSD Medium-term Trend: Bearish
Resistance: $168, $166, $164
Support: $156, $158, $160
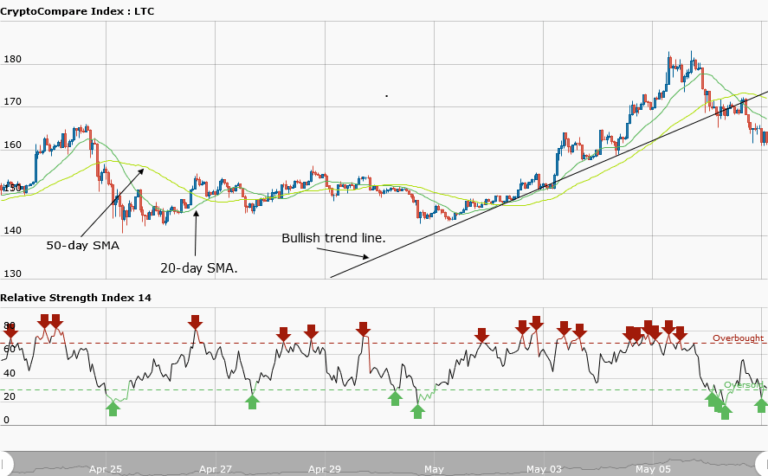
The price of Litecoin was range-bound throughout last week. The price of the asset was fluctuating between the resistance level at $155 and the support level at $145. As at Friday May 4, the resistance level of $155 was broken by the bulls. Today, Litecoin is trading at $160.53.
However, on May 5, the price of Litecoin had a bullish breakout which made price to reach the high of $183 but was resisted and it fell to the low of $160. The Price also broke the bullish trend line after it was resisted by the bears which signal the end of the trend. Meanwhile, the relative strength index period 14 is level 23 which indicates that the market is oversold – suggesting bulls will take control of the market.
LTCUSD Short-term Trend: Bearish

In the daily chart, the price of Litecoin was also bearish. The price of the asset was fluctuating between the levels of $166 and $172. During the time of its fluctuations, the price fell to the low of $162. However, the 20-day moving average and 50-day moving average are trending southward indicating a bearish outlook. The price of Litecoin is said to be oversold and as such the asset will find support at $158 and later have a bullish movement.
The views and opinions expressed here do not reflect that of CryptoGlobe.com and do not constitute financial advice. Always do your own research.


