

LTCUSD Medium-term Trend: Ranging
Resistance: $166, $164, $162
Support: $154, $156, $158
The LTCUSD pair is the third cryptocurrency that broke it’s resistance level at $155 from the range bound zone. Price broke the resistance level and rose to the high of $164 and later pulled back to the low of $158. Nevertheless, the asset commenced a range bound movement. Today, Litecoin is trading at $158.41.
However, from the weekly chart, price of Litecoin was resisted at the resistance level of $160 when it was initially broken and price pulled back below it. Litecoin may reach the high of $180 if the Bulls overcome the resistance level at $160.
LTCUSD Short-term Trend: Ranging

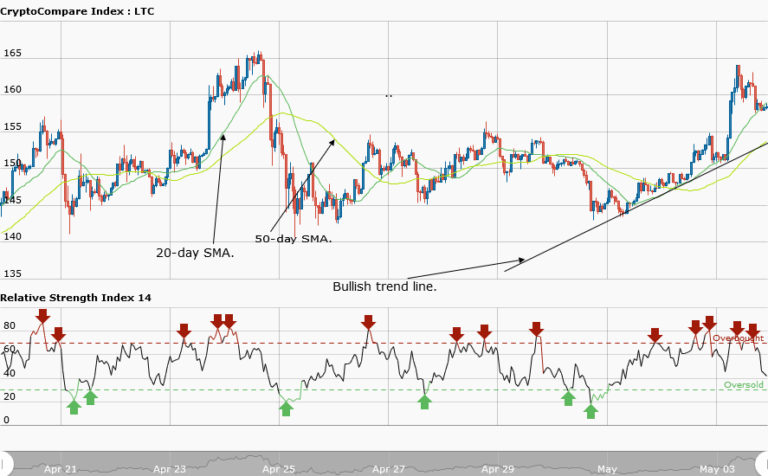
In the daily chart, price of the asset is ranging. Litecoin was trading horizontally at a price of $152, and later it had a bullish movement which took price to the high of $164. Later, price pulled back as aresult of the resistance by the Bears.
The views and opinions expressed here do not reflect that of CryptoGlobe.com and do not constitute financial advice. Always do your own research.


