

LTCUSD Medium-term Trend: Ranging
Resistance: $122, $121, $120
Support: $116, $117, $118
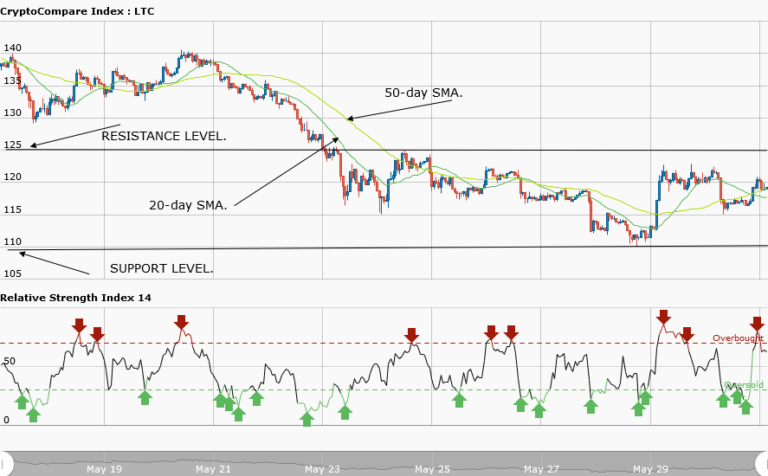
The LTCUSD pair was in a bullish market yesterday. The price of the asset has not been able to make a comeback at $120. However, Litecoin broke the bearish trend line and indicated that the bearish pressure might have ended. The asset was trading at $119.24 at the time of writing. However, the weekly chart shows that Litecoin is ranging from the resistance level at $125 to the support level at $110.
Today, the asset price is yet to make a comeback at $120. Litecoin has been fluctuating below and above $120. Meanwhile, in ranging markets, breakouts are imminent and pending orders are the solution. You can place a buy stop at the $125 resistance level for a bullish breakout. Similarly, a sell stop at the support level of $110 for a bearish breakout.
However, the relative strength index is level 64, indicating that the asset price is in the bullish trend zone. The price is expected to rise to $130 but may face resistance at $122.
LTCUSD Short-term Trend: Ranging

The daily chart shows that Litecoin is in a ranging market. The asset fell from $122 to $116 and started a range-bound movement. Later, it rose to $121.
The views and opinions expressed here do not reflect that of CryptoGlobe.com and do not constitute financial advice. Always do your own research.


