

LTCUSD Medium-term Trend: Ranging
Resistance: $150, $149, $148
Support: $144, $145, $146
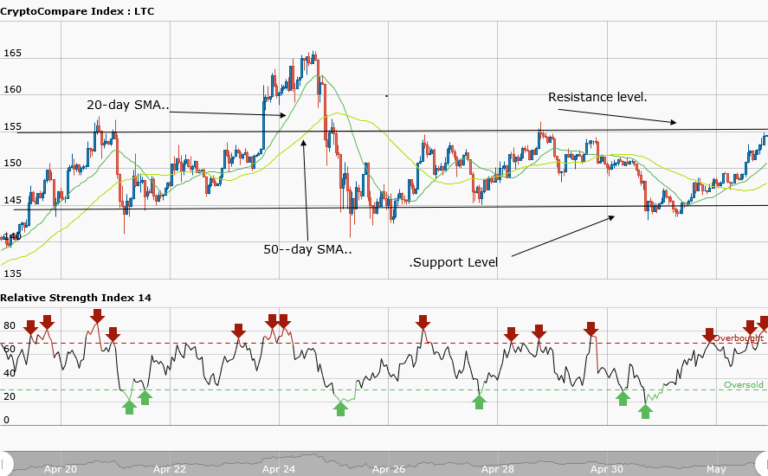
Yesterday, May 2, the price of Litecoin was also in a ranging market. Price of the asset is ranging from the resistance level at $155 and the support level at $145. However, neither of the bulls nor the bears have the opportunity of breaking any of the levels. Litecoin is currently trading at $154.49 as at the time of writing. From the weekly chart, price of Litecoin is in a bullish market.
The bulls are in control of the market and they are about breaking the resistance level at $155. Today if the bulls succeed in breaking the resistance level, price may reach the high of $ 180. But if the bulls are again resisted by the bears and price breaks the support level at $145; then Litecoin may fall to its low at $114.
LTCUSD Short-term Trend: Ranging

In the daily chart, the bulls were in control of price and they made their way to the resistance level at $155. However, they were resisted and there was a price pullback. Meanwhile, the relative strength index period 14 is level 31 which indicates that the market is oversold suggesting bulls to take control of the market.
The views and opinions expressed here do not reflect that of CryptoGlobe.com and do not constitute financial advice. Always do your own research.


