

LTCUSD Medium-term Trend: Ranging
Resistance: $126, $124, $122
Support: $114, $116, $118
Yesterday, May 24, the LTCUSD pair fell to a low of $120, and it was assumed that Litecoin’s price would reach a low of $115, if the bearish trend continued. Yesterday, it was stated that the end of price decline could be determined by the use of a bearish trend line. However, price of the asset is currently trading at $120.10.
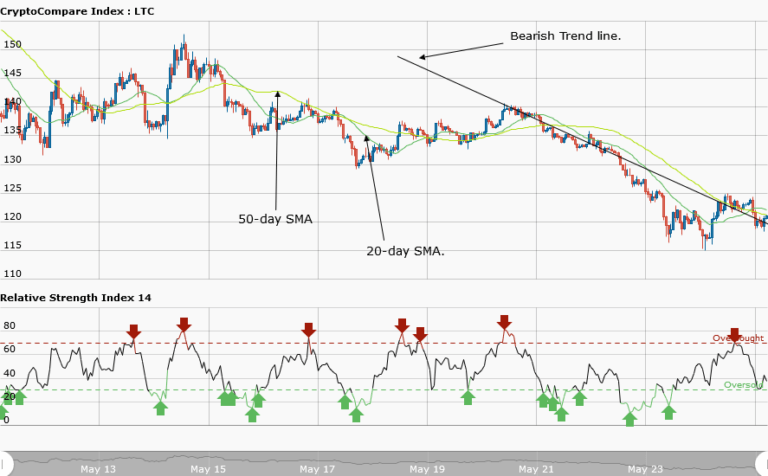
Today, from the weekly chart, Litecoin actually fell to $116 but the price made a pullback above the $120 price level. A bearish trend line has been drawn across the cryptocurrency’s chart to determine the bearish trend. Litecoin is now ranging above the $120 level against the bearish movement. The asset has broken the bearish trend line and the candlestick closed on the opposite side of the trend line.
With this development, it is assumed that the bearish trend is over. Traders can initiate long positions above the $120 price level. Also, a stop loss should be placed below the price at $115.
LTCUSD Short-term Trend: Ranging

On the daily chart, Litecoin is in a bullish movement. The asset fell from $120 to a low of $116. At a price of $116, the asset made a bullish movement to $122. Even at that level, the asset resumed a range bound movement.
The views and opinions expressed here do not reflect that of CryptoGlobe.com and do not constitute financial advice. Always do your own research.


