

LTCUSD Medium-term Trend: Bearish
Resistance: $132, $130, $128
Support: $120, $122, $124
Yesterday, the LTCUSD pair fell to the low of $133.22 after the price was repelled from the resistance of $140. It was assumed that the asset might reach the low of $115, if the downtrend continued. Yesterday, the relative strength index period 14 indicated that the market was oversold suggestingthat bulls would take control of the market. Litecoin is currently trading at $126.23 as at the time of writing.
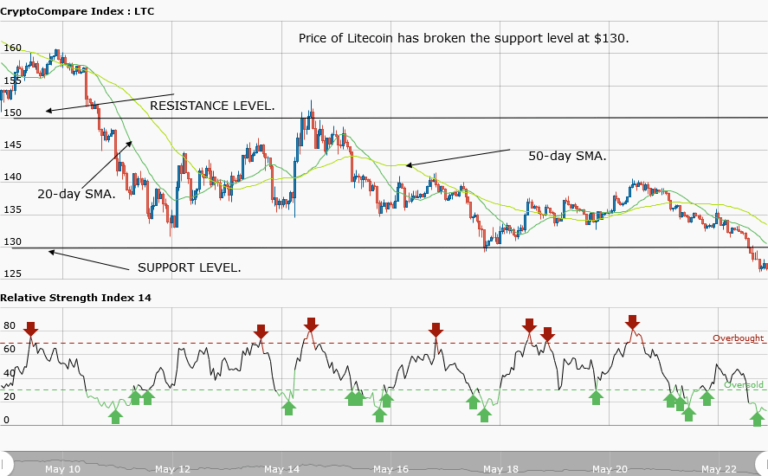
Today, from the weekly chart, the price of the asset has broken the support level at $130. However, with this breakout the asset may likely decline further to the low of $115 as per the previous analysis. Meanwhile, the relative strength index period 14 is level 12 indicating that the market is seriously oversold – suggesting bulls will take control of the market. Nevertheless, the price of the asset can still rally even at the oversold market condition.
If the price gets to the support level at $115 traders should initiate long trades and place stop loss at a price of $100.
LTCUSD Short-term Trend: Bearish

On the daily chart, the price of Litecoin is in a smooth downtrend. The trend line shows the resistance levels where you can take your short trades. Meanwhile, the 20-day moving average and the 50-day moving average are trending southward.
The views and opinions expressed here do not reflect that of CryptoGlobe.com and do not constitute financial advice. Always do your own research.


