

LTCUSD Medium-term Trend: Bearish
Resistance: $145, $140, $135
Support: $115, $120, $125
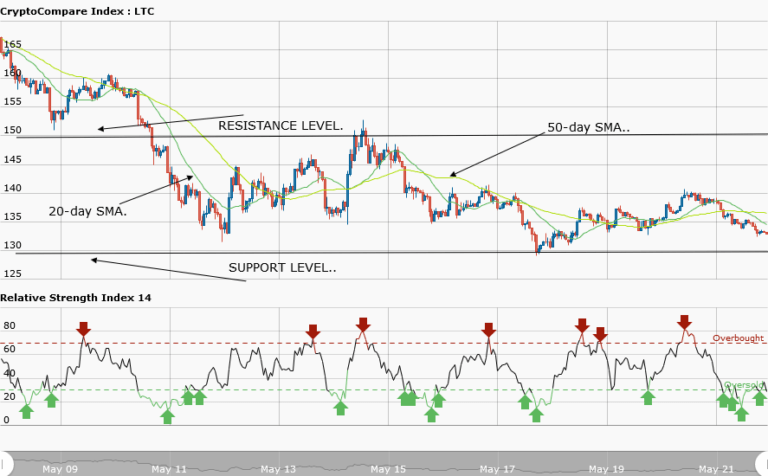
Yesterday, May 21st the LTCUSD pair was range bound between the levels of $150 and $130. The asset was ranging and was resisted at a price of $140. If the price of Litecoin breaks the resistance at $140, the asset will reach the highs of $150 and $160. The LTCUSD pair is currently trading at $133.22 at the time of writing. From the weekly chart, the resistance at a price of $140 caused Litecoin to fall to the low of $133.22.
If the bears succeed in breaking the support level at $130, Litecoin will fall to the low of $115. The asset will continue with its range bound movement if the support level at $130 is not broken. Meanwhile, the relative strength index period 14 is level 29 indicates that the market is oversold suggesting that bulls will take control of the market.
LTCUSD Short-term Trend: Bearish

On the daily chart, the price of Litecoin is falling and heading towards the critical support level at $130. The bearish outlook is confirmed by the 20-day moving average and the 50-day moving average that is trending southward.
The views and opinions expressed here do not reflect that of CryptoGlobe.com and do not constitute financial advice. Always do your own research.


