

LTCUSD Medium-term Trend: Ranging
Resistance: $142, $141, $140
Support: $136, $137, $138
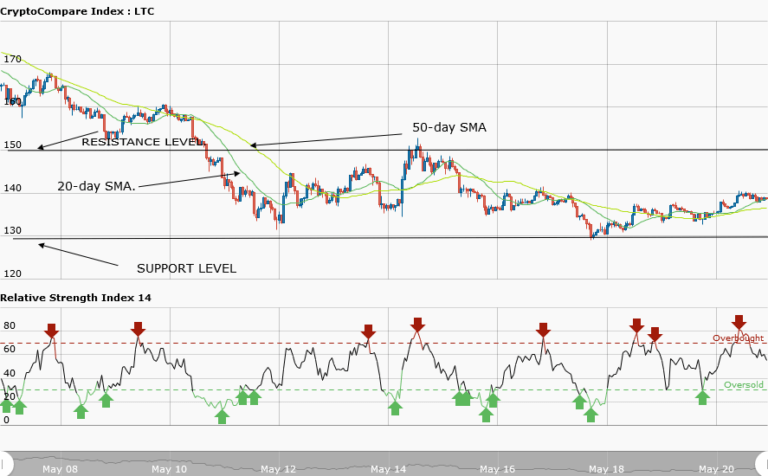
Last week, the price of Litecoin was fluctuating between a resistance level at $150 and a support level at $130. During the week, Litecoin attempted to break the support level at $130, but faced resistance at $129. At other times, the asset attempted to break the resistance level at $150 but faced resistance at $151. At press time Litecoin is trading at $136.1
From the weekly chart, Litecoin did not make any appreciable movement because of the resistance at $140. The asset’s bullish movement was stopped at the $140 resistance. If the price breaks it, Litecoin will reach highs of $150 and $160. On the other hand, the asset will be in a range bound movement if that level holds. Meanwhile, the relative strength index period 14 is level 54, which indicates that the price is in the range bound zone.
LTCUSD Short-term Trend: Ranging

On the daily chart, the price of Litecoin made a bullish movement to a high of $140. Litecoin fell at the resistance level of $140 and made a range bound movement.
The views and opinions expressed here do not reflect that of CryptoGlobe.com and do not constitute financial advice. Always do your own research.


