

LTCUSD Medium-term Trend: Ranging
Resistance: $150, $149, $148
Support: $144, $145, $146
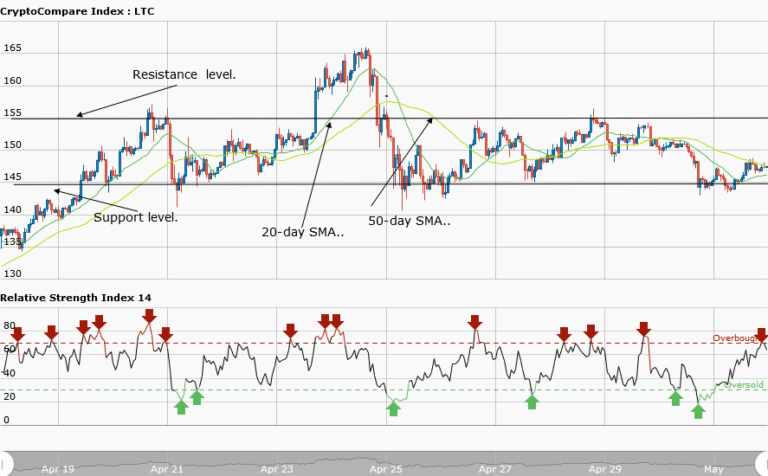
Yesterday, May 1, Litecoin price was in a ranging market. The LTCUSD pair is fluctuating between the resistance level at $155 and the support level at $145. There was a tendency of the price breaking any of these levels. However, the resistance level at $155 and the support level at $145 were created since April 21, when the bears resisted the bulls and the price was brought to $145.
Then the bulls took control of the price and broke that same level within four days to $165. The bears brought the price to $145 again. Since then, neither the bulls nor the bears have had the opportunity of breaking any of these levels.
However, if the bears break the support level at $145, the price will fall to $114. In the same vein, if price breaks the resistance at $155, it will soar to $180.
LTCUSD Short-term Trend: Ranging

The daily chart shows that the Litecoin price is also ranging. The price of the asset fell to $144 and tested that level several times before it had a bullish movement to $149. At that point, the price commenced its range bound movement.
The views and opinions expressed here do not reflect that of CryptoGlobe.com and do not constitute financial advice. Always do your own research.


