

LTCUSD Medium-term Trend: Bearish
Resistance: $141, $140, $139
Support: $135, $136, $137
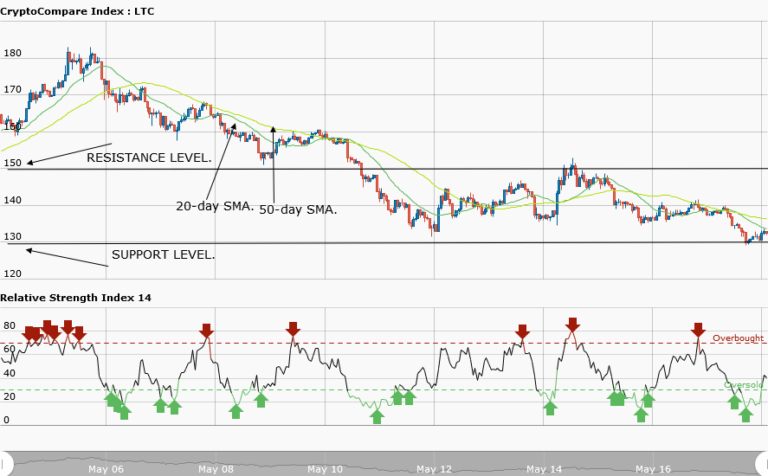
The LTCUSD pair was range-bound between the resistance level at $150 and the support level at $130. On May 15, the Bulls tested the resistance level at $150 but were resisted at $152 which led to the asset falling to $136. It was assumed that if the price broke the resistance level, Litecoin would revisit the $160 high but will face resistance at $168.
On the other hand, if the price brakes the support level, the asset will fall to $120. The price was trading at $132.43 at the time of writing. The weekly chart shows Litecoin in a bearish market. The 20-day moving average crossed below the 50-day moving average, indicating Litecoin’s price fall.
If the price breaks the support level at $130 or from the current market price, the asset will nosedive to the lows of either $120 or $115. On the other hand, if the bulls hold that level, the asset will resume its range-bound movement.
LTCUSD Short-term Trend: Ranging

The daily chart shows that the price was in a range-bound movement before it fell to $130.
The views and opinions expressed here do not reflect that of CryptoGlobe.com and do not constitute financial advice. Always do your own research.


