

LTCUSD Medium-term Trend: Ranging
Resistance: $160, $155, $150
Support: $130, $135, $140
Yesterday, May 14th the LTCUSD pair was in a downtrend and the price fell to the low of $133. The price of the asset had a bullish movement that brought it above the $140 level. It was assumed yesterday that if the support level at $140 was broken, it would find support at either $133 or $130. The price of Litecoin is currently trading at $146.18 as at the time of writing.
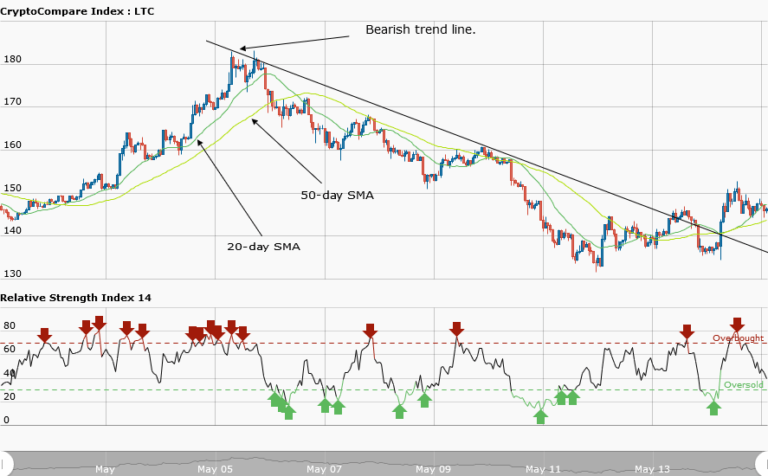
However, from the weekly chart, the support level at $140 was not broken rather the asset is ranging from the levels of $140 and $150. Also, note that the price of Litecoin has broken the bearish trend line and the candlestick closed on the other side of the trend line. This implies that the downtrend is over.
The relative strength index period 14 is level 57 indicates that the asset is in the range bound zone. Therefore, the asset is likely to range between the levels of $140 and $150 pending a possible breakout.
LTCUSD Short-term Trend: Ranging

On the daily chart, the price of the asset is in a ranging market. The asset was ranging horizontally at a price of $135. While at that price, the asset had a bullish breakout that broke the support level at $140. Then the price of the asset reached the high of $150. The resistance by the bears brought the price to the low of $145.
The views and opinions expressed here do not reflect that of CryptoGlobe.com and do not constitute financial advice. Always do your own research.


